
With the rapid development of cognitive neuroscience, functional near infrared spectroscopy (fNIRS) is becoming an important force in the field of non-invasive brain imaging. However, in order to maximize the scientific and clinical value of fNIRS, "spatial alignment" has become an indispensable technical threshold. What are the AAL maps, Brodmann partitions, Talairach coordinate system, and MNI152 templates that we commonly see in papers? What is the difference between the classical 10-20, 10-10, and 10-5 systems? How are they applied to the spatial alignment of fNIRS?
Today, we take you through a classic study published in NeuroImage (2014) to systematically sort out the basics and key techniques of fNIRS spatial alignment. Whether you are a novice beginner or wish to optimize your research methods, this tweet will open the door for you to understand the mechanism of fNIRS spatial localization, and help you walk more steadily and farther on the road of data interpretation and results publication.
This article is about 12,000 words long.
catalogs
I. Overview of fNIRS technology
(i) Basic principles of fNIRS
(ii) Technical advantages of fNIRS
(iii) Application areas of fNIRS
II. Need for spatial alignment
III. Standard stereotactic coordinate system
(i) Early brain mapping
(ii) Modern average brain template
(iii) Probabilistic macroanatomy template
(iv) Other data standardization methods
IV. Methods of describing the location of the scalp
(i) International 10-20 system
(ii) 10-10 and 10-5 systems
(iii) Correspondence between scalp position and MNI space
V. Alignment of fNIRS data with structural images
(i) Individual data alignment
(ii) Cohort data alignment
VI. Probability alignment
VII. Application of Probabilistic Alignment in DOT
VIII. Virtual alignment
IX. Software implementation
X. Child and infant data alignment
XI. Conclusion
XII. About the author
Daisuke Seiki
Information on Mrs. Ippei Tan and her laboratory
I. Overview of fNIRS technology: "Light" to illuminate brain activity
(i) Fundamentals of fNIRS
The fNIRS technology was born out of a deep understanding of the close connection between brain activity and hemodynamics. When a specific region of the brain is activated, neuronal activity in that region triggers a series of physiological changes, the most notable of which is an increase in local cerebral blood flow, accompanied by a change in the oxygenation state of hemoglobin. fNIRS takes advantage of hemoglobin's unique ability to absorb near-infrared (NIR) light by emitting NIR light into the scalp and measuring the change in the intensity of the light that is returned to the scalp and scattered by the brain tissue, thus indirectly obtaining information about the hemodynamics of the cerebral cortex, and thus inferring functional activity. This indirectly obtains hemodynamic information from the cerebral cortex, which can be used to infer the functional activity of the brain.
Simply put, when an area of the brain is active, the amount of oxyhemoglobin in that area increases and the amount of deoxyhemoglobin decreases accordingly. Oxyhemoglobin and deoxyhemoglobin absorb near-infrared light differently, and by detecting this difference in light absorption, the fNIRS device is able to capture hints of brain activity. This is like putting a pair of "light-sensitive glasses" on the brain, allowing us to "see" changes in brain activity.
(ii) Technical advantages of fNIRS
Compared to other neuroimaging techniques, fNIRS has taken its place in the field of neuroscience research due to its unique advantages.
First, the fNIRS device is characterized by its compact size and portability. It is free from the harsh restrictions of traditional large-scale imaging devices on experimental sites, and researchers can easily bring it to various natural scenes for experiments, such as school classrooms, home environments, and even outdoor places. This makes it possible to study brain function in real-life situations and obtain more natural and realistic brain activity data.
Second, fNIRS is easy to perform and requires relatively little from the subject. Subjects do not need to remain stationary for long periods of time, as is the case with magnetic resonance imaging (MRI), nor do they need to worry about the discomfort or risks associated with strong magnetic fields. This not only lowers the barrier to participation, but also makes fNIRS applicable to a wider range of people, including children, the elderly, and special populations with certain medical conditions that prevent them from undergoing an MRI.
Further, fNIRS has good temporal resolution. It can capture dynamic changes in brain activity in real time, providing researchers with real-time information about the functional activity of the brain. This is important for the study of rapidly occurring cognitive processes, such as instantaneous shifts in attention and rapid fluctuations in mood.
(iii) Application areas of fNIRS
With these advantages, fNIRS shows great potential for application in many fields.
In the field of cognitive neuroscience, fNIRS has become a powerful tool for researchers to explore human advanced cognitive functions. By allowing subjects to perform a variety of cognitive tasks, such as memory tests, language comprehension and expression tasks, and attention focus training, while using fNIRS to monitor changes in the activity of specific regions of the brain, researchers can gain insight into the mechanisms by which the brain works during these cognitive processes. For example, it was found that the hippocampus and prefrontal cortex of the brain show significant fNIRS signaling changes when performing memory encoding and recall tasks, suggesting that these regions play a key role in the memory process.
In the field of clinical medicine, fNIRS also plays an important role. It can be used for early diagnosis and condition monitoring of neurological diseases such as brain injury, stroke, and Alzheimer's disease. By monitoring changes in blood flow and oxygenation in specific areas of the brain, doctors can detect abnormalities in brain function in a timely manner, providing an important basis for early intervention and treatment of diseases. In addition, fNIRS can also be used to assess the effectiveness of rehabilitation therapy, helping doctors to adjust the treatment program and improve the quality of patients' rehabilitation.
II. The need for spatial alignment: precise "localization" of brain activity
Despite the achievements of fNIRS technology in neuroscience research, it faces a critical problem that needs to be addressed - the lack of structural information. Simply put, while fNIRS is able to detect changes in activity in the cerebral cortex, it is unable to accurately determine exactly where in the brain these activities are occurring. This is similar to hearing a sound coming from a distance, but not being able to determine the direction and exact location of the sound's source.
In neuroscience research, it is crucial to accurately determine the location of brain activity. Different brain regions have different functions, and only by mapping brain activity to specific anatomical structures can we gain a deeper understanding of the working mechanisms of the brain and reveal the intrinsic links between neural activity and cognition and behavior. For example, when we study language function, we need to know which regions of the brain are involved in the process of language production, comprehension and expression, and how these regions collaborate with each other. Without being able to accurately determine the location of brain activity, it is difficult to accurately interpret and analyze the results of the study.
To address this problem, spatial alignment techniques were developed. The core objective of spatial alignment is to establish a precise correspondence between the scalp locations measured by fNIRS and the actual functional areas on the surface of the cerebral cortex. Through spatial alignment, we can combine the fNIRS data with the anatomical structure of the brain, so that we can find the exact "coordinates" for each brain activity on the "map" of the brain, and realize the precise "localization" of the brain activity. "positioning" of brain activities. This is of great significance to the in-depth study of brain function and the development of neuroscience.
III. Standard stereotactic coordinate system: a "universal map" for brain research
In neuroscience research, in order to compare and integrate brain data between different individuals, a unified standard is needed to describe the location and structure of the brain. Just as countries on Earth use a uniform latitude and longitude to determine their geographic locations, the field of brain research also needs a "universal map", which is a standard stereotactic coordinate system.
(i) Early brain mapping
Early on, the emergence of the Brodmann atlas laid a solid foundation for the anatomical study of the brain.Brodmann divided the cerebral cortex into about 50 different regions through a meticulous study of the cellular chemical structure of the cerebral cortex. These regions have unique cellular composition and structural characteristics, which provided important anatomical references for later studies of brain function.Although Brodmann's atlas is based on two-dimensional descriptions, it has been an important basis for neuroscientists to study the structure and function of the brain for a long time.
As technology continues to evolve, the Talairach atlas was developed, introducing a stereotactic coordinate system based on an in-depth study of the brain of an elderly white woman. This coordinate system allows the major anatomical structures of the brain to be accurately depicted in a generalized three-dimensional space and covers all Brodmann areas. The Talairach atlas has become an important tool in neuroscience research by providing a more precise and uniform standard for brain research and is widely used in fMRI analysis software.
(ii) Modern average brain template
However, Talairach mapping has certain limitations; it is based on a single individual brain and cannot fully represent the diversity and variability of the human brain. To compensate for this defect, modern average brain templates have been gradually developed. Among them, the MNI152 average brain template is the most widely used one. By aligning and averaging 152 different individual brains, it constructs a template that can more broadly represent the overall structure of the human brain.The emergence of the MNI152 template provides a more objective and universal standard for neuroscience research, and it has been widely used in statistical analysis software such as SPM.
In order to obtain anatomical information in MNI space more conveniently, the Automatic Anatomical Labeling (AAL) tool based on the Colin27 standard brain has been developed.The AAL tool provides a detailed labeling of the macroscopic anatomical structures of the Colin27 brain based on the coordinates in MNI space. Researchers can quickly obtain information about the macroscopic anatomical structure corresponding to the location, such as the brain region and gyrus to which it belongs, by inputting specific coordinates. In addition, there is the Talairach Daemon tool for the Talairach coordinate system, and they all provide great convenience for researchers in brain anatomy research.
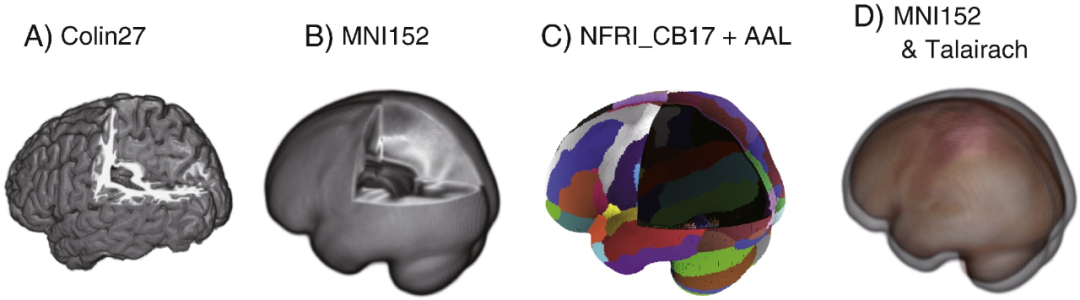
Comparison between standard brains. All standard brains were aligned and viewed from the same angle. (A) Macroanatomical information withColin27 brain model. (B) MNI152 template with smoother cortical structure due to averaging. (C) The National Food Research Institute of Japan Standard Brain 17 (NFRI_CB17) optimized for functional near-infrared spectroscopy (fNIRS) data alignment. The cortical surface is compressed into a single layer to form a shell-like structure where additional structural information like macroanatomical mapping and 10/20 localization points can be aligned. In this case, a pattern-filtered automatic anatomical labeling atlas (AAL) is superimposed. (D) MNI template and Talairach template aligned in the same coordinate system. Although their shapes are similar, the Talairach template is slightly smaller.
(iii) Probabilistic macroanatomy template
Although the AAL and Talairach Daemon tools have played an important role in the study of brain anatomy, they still have some limitations. Since they are both based on the brain of a single individual, they cannot adequately account for anatomical differences between individuals. In order to more accurately characterize the probabilistic nature and variability of brain anatomy, the probabilistic macroanatomy template LPBA40 was created.LPBA40 is based on 40 individual brains with macroanatomical segmentation at the level of the cerebral gyrus, and is able to provide richer and more accurate probabilistic macroanatomical information. This enables researchers to better consider individual differences when studying brain structure and function, improving the accuracy and reliability of the results.
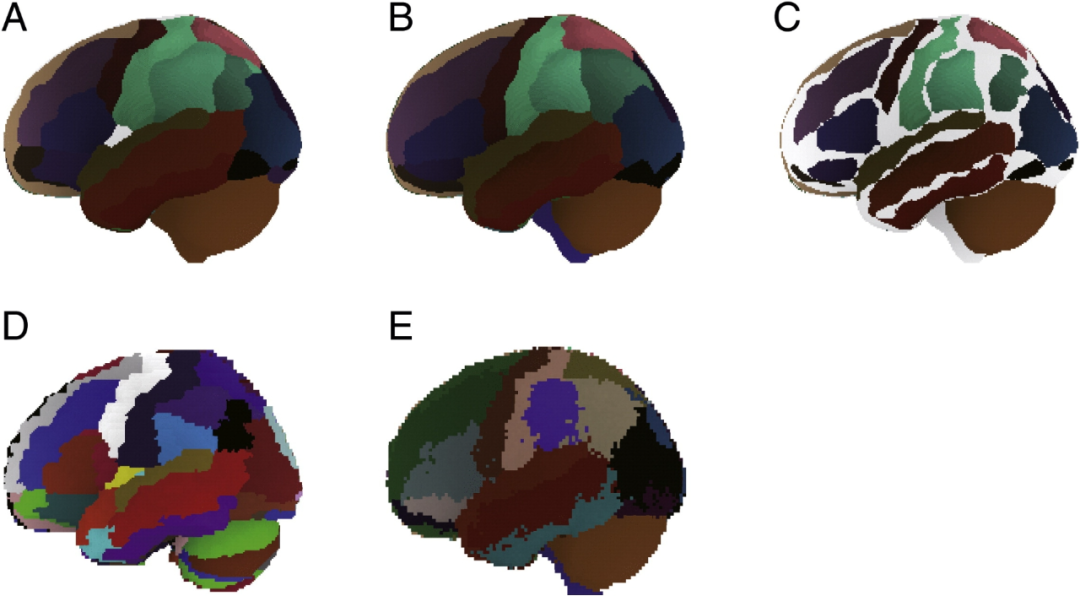
Comparison between macroanatomical atlases in MNI space. (A) Automated anatomical labeling atlas (AAL) based on Colin27's macroanatomical segmentation was pattern filtered and projected onto the National Food Research Institute of Japan Standard Brain No. 17 (NFRI_CB17) for spatial alignment in functional near-infrared spectroscopy (fNIRS). Some regions were integrated to maintain compatibility with the macroscopic anatomical segmentation in LPBA40. (B) LPBA40 atlases based on probabilistic macroanatomical segmentation of 40 subjects were pattern filtered and projected onto NFRI_CB17 for fNIRS spatial alignment. (C) AAL atlases and LPBA40 atlases overlapped each other. Co-labeled regions are depicted in different colors. 64.6% macroanatomically labeled voxels (42452/65745) in LPBA40 overlap with voxels in AAL, while 69.2% macroanatomically labeled voxels (42452/61349) in AAL overlap with voxels in LPBA40. (D) Unsmoothed raw AAL atlas. (E) Unsmoothed original LPBA40 atlas.
Meanwhile, the MNI152 template has been continuously developed and improved.ICBM152NLin preserves the major sulcus structures through nonlinear iterative transformations, which makes the template closer to the real brain morphology. However, at present it still has certain deficiencies in macroanatomical labeling resources, which need to be further improved and supplemented.
(iv) Other data standardization methods
In addition to the standard brain templates and tools mentioned above, there are a number of other data normalization methods that have been used in neuroscience research. Among them, Freesurfer software is a commonly used data normalization tool. It maps the brain structure onto a standard brain shape by segmenting, unfolding and deforming the brain, which enables researchers to observe and analyze the macroscopic anatomical structure of the brain more intuitively.Freesurfer software, which has a high affinity with DOT technology, has been applied in some fNIRS studies, providing a new option for the standardization of fNIRS data.
Displaying fNIRS data in these standard coordinate systems enables comparisons and integration between data from different individuals, different studies, and different modalities. However, due to a number of technical difficulties, displaying fNIRS data in these generalized stereotactic spaces has not yet become a common practice. Researchers are still exploring and improving the techniques to promote the widespread use of fNIRS data in standard coordinate systems.
IV. Methods of describing the location of the scalp: building "bridges" between cranio-cerebral structures
In fNIRS research, when MRI structural images cannot be acquired, how to accurately describe the scalp position and establish the correspondence between cranial - brain structures becomes a key issue in realizing spatial alignment. Currently, the international 10-20 electrode placement system is one of the most commonly used methods.
(i) International 10-20 system
The International 10 - 20 system was originally designed for the localization of scalp electrodes for electroencephalography (EEG) and has also been widely used in fNIRS studies due to its good reliability and reproducibility. The system works by identifying several key marker points on the skull, such as the nasal root (Nz), the external occipital ramus (Iz), and the right and left preauricular points (RA, LA), and then using these as a basis for systematically placing other marker points on the scalp according to the spacing of 101 TP3T or 201 TP3T. In this way, the International 10 - 20 system is able to accurately characterize the relative coordinates of various locations on the scalp.
Several studies have verified the existence of more stable and consistent correspondences between scalp position and the underlying brain structures in the International 10 - 20 System by using a variety of techniques such as autopsy, X-rays, CT scans, and MRI. This allowed researchers to utilize these correspondences to make preliminary correlations between scalp positions measured by fNIRS and functional areas of the cerebral cortex. For example, it has been found that in the International 10 - 20 system, the brain region corresponding below the F3 position is usually closely associated with the functional activity of the frontal lobes.
(ii) 10-10 and 10-5 systems
As neuroscience research continues to grow, so does the demand for greater precision in scalp electrode positioning. In order to meet this demand, the 10 - 10 system and the 10 - 5 system were created based on the international 10 - 20 system.
The 10 - 10 system builds on the international 10 - 20 system by further increasing the density of electrode locations, defining 81 electrode locations. It is able to describe the scalp position more accurately through more detailed spacing settings, and improves the localization accuracy of the functional areas of the cerebral cortex.The modified form of the 10 - 10 system has been accepted as a standard by the American Clinical Neurophysiology Society (ACNS) and the International Federation of Clinical Neurophysiology Societies (IFCN) and has been widely used in neuroscience research.
The 10 - 5 system is based on the 10 - 10 system and further increases the electrode density with more than 300 electrode positions. It can provide higher resolution scalp position information, which is important for studying the fine function of the cerebral cortex. However, due to the high electrode density, it also faces some challenges in practical applications, such as in the occipital region, where it may be difficult to discriminate the scalp position due to the overly dense electrodes.
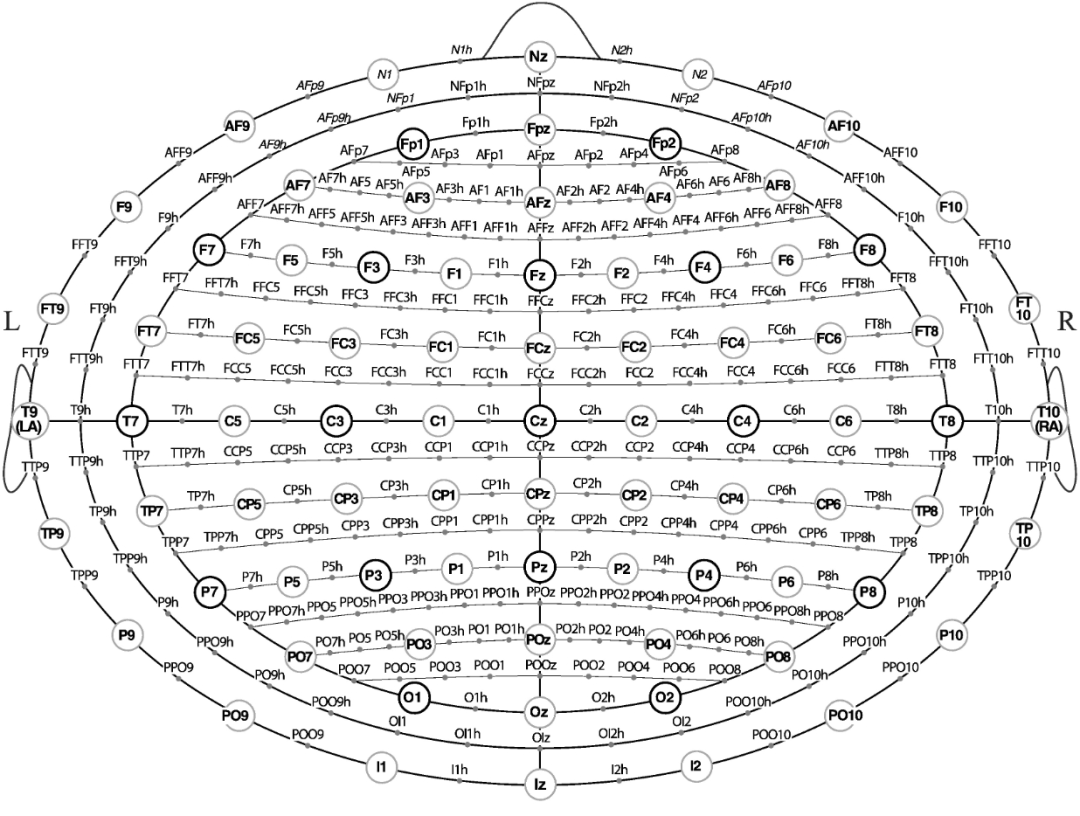
Points for 10-20 systems are indicated by dark gray circles, points for 10-10 systems are indicated by light gray circles, and points for 10-5 systems are indicated by gray dots.
(iii) Correspondence between scalp position and MNI space
In order to correlate scalp positions with the standard MNI coordinate system, researchers have conducted extensive research work. By projecting positions 10 - 20, 10 - 10, and 10 - 5 onto the Brodmann atlas, the researchers established a correspondence between scalp positions and macroscopic anatomical structures. At the same time, these scalp positions were correlated with the MNI coordinate system through mathematical transformations and model construction.
However, this correspondence is difficult to understand intuitively. To address this issue, Cutini et al. created a realistic MNI152 brain and head model. Researchers could perform probe positioning and real-time mapping simulations by sliding an actual fNIRS probe holder over this real model. This approach makes the correspondence between scalp location and MNI space more intuitive and easier to understand, providing a more convenient tool for fNIRS research.
V. Alignment of fNIRS data with structural images: Towards accurate "docking"
(i) Individual data alignment
When researchers are able to acquire structural MRI images of a subject, they can align the fNIRS data with the subject's own structural MRI. This process is like finding a precise "localization anchor" for the fNIRS data, which allows the fNIRS data to be accurately localized and displayed in the anatomical structures of the brain.
A common method is to place markers, such as vitamin E capsules or pine nut beads, on the scalp and then perform a structural MRI scan with the markers. In this way, the location of the markers can be clearly seen on the MRI image, thus directly determining the location of the fNIRS probe or channel in the brain. This method is simple and straightforward, but attention needs to be paid to where and how many markers are placed to ensure that it accurately reflects the location of the fNIRS probe.
Another, more common method is the use of a three-dimensional (3D) digitizer. First, a 3D digitizer is used to record the location of the fNIRS probe or channel on the scalp, along with the location of at least three scalp marker points, usually the bilateral pre-auricular points and the root of the nose are chosen as marker points. These marker points can be clearly identified on both scalp and MRI images. The position of the fNIRS probe or channel is then transformed into MRI space by rigid body transformations, including rotation and translation operations. In this way, the fNIRS data can be accurately aligned with the subject's structural MRI.
After transforming probe or channel positions into MRI space, fNIRS data can be presented in different forms. One way is to represent it as discrete channel data, i.e., functional data, such as relative signal changes in oxyhemoglobin, are bound to each channel. Another way is through interpolation algorithms that create continuous topographic images, allowing the functional activity of the brain to be presented in a more intuitive way. However, these data are initially located at the scalp level, and in order to more accurately reflect the functional activity of the cerebral cortex, the data need to be projected onto the cortical surface.
Data can be projected onto the cortical surface in a variety of ways, e.g., by finding the cortical point that is closest to a given scalp point and projecting the data onto that point, by drawing a vertical line from the tangent plane of the scalp point and projecting the data onto the cortical point that intersects with the vertical line, or by drawing a line toward a central location of the brain, e.g., the brain's center of mass, and projecting the data onto the corresponding cortical point. In addition, it is possible to reconstruct a three-dimensional functional image of each channel consisting of a source-detector pair, based on the optical properties of the head and brain tissue, using a photon measurement density function. By these methods, the distribution of the source over the cerebral cortex can be estimated more accurately and the precise localization of fNIRS data over the cortex can be achieved.
Channel-based individual functional near-infrared spectroscopy (fNIRS) data were aligned to the subject's own structural image. (A) Positions of multichannel fNIRS channels (blue dots) and scalp reference marker points (black dots) on the scalp were measured in a real-world coordinate system using a 3D digitizer. nz represents the root of the nose; AL represents the anterior point of the left ear; and AR represents the anterior point of the right ear on the opposite side of the head. (B) Structural images of the head and brain were acquired using magnetic resonance imaging (MRI) in another real-world coordinate system. Three scalp marker points (red squares; one is on the other side of the head) were also manually identified. (C) The 3D digitized scalp reference marker points (black dots) were merged onto the corresponding marker points on magnetic resonance imaging (MRI) using a rigid-body transformation: thus, the position of fNIRS was also transformed and co-aligned with the subject's own MRI. (D) Finally, the fNIRS channels on the scalp were projected onto the cortical surface (smoothed for better visibility).
(ii) Cohort data alignment
In population studies, integrating fNIRS data from multiple individuals into a standard brain space is significant for mining commonalities and differences in group brain function. However, the brains of different individuals are naturally different in structure and function, which poses many challenges for data integration.
In performing the channel analysis, the first step was to convert the fNIRS channel positions of each individual to real-world coordinates compatible with structural MRI. Subsequently, with the help of tools such as SPM software, a spatial normalization operation is implemented on the individual MRI head images to match the shape and size of the MNI standard brain template. In this process, a deformation field matrix is generated, which records the transformation information from the individual MRI space to the MNI space.
Next, by applying the inverse deformation field matrix to the fNIRS probe, the channel locations and their cortical projections, the coordinate values of these locations in MNI space are obtained. Averaging the channel locations of multiple individuals in MNI space yields the most representative MNI coordinate values, realizing the initial integration of group data in standard brain space.
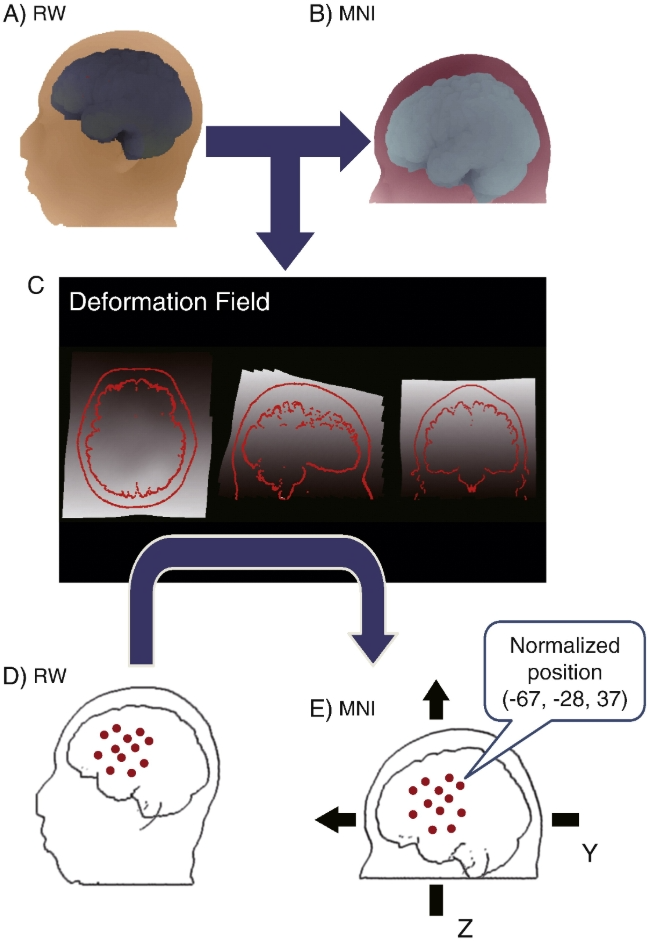
Channel-based individual functional near-infrared spectroscopy (fNIRS) data were normalized to standard brain space. Magnetic resonance imaging (MRI) images of the subject's own body in the real-world (RW) coordinate system (Fig. A) were normalized to the MNI 152 template using the statistical parameter mapping (SPM) procedure, allowing them to be rendered in MNI space (Fig. B). A deformation field reflecting the distortion transformation matrix from real world space to MNI space was extracted (Fig. C). Using this deformation field, the discrete fNIRS channel position data (Fig. D), which is in real-world space, is transformed into MNI space (Fig. E). Ultimately, the coordinate values of each fNIRS channel are available in MNI space (Matlab toolbox available at http://www.jichi.ac.jp/brainlab/tools.html获取).
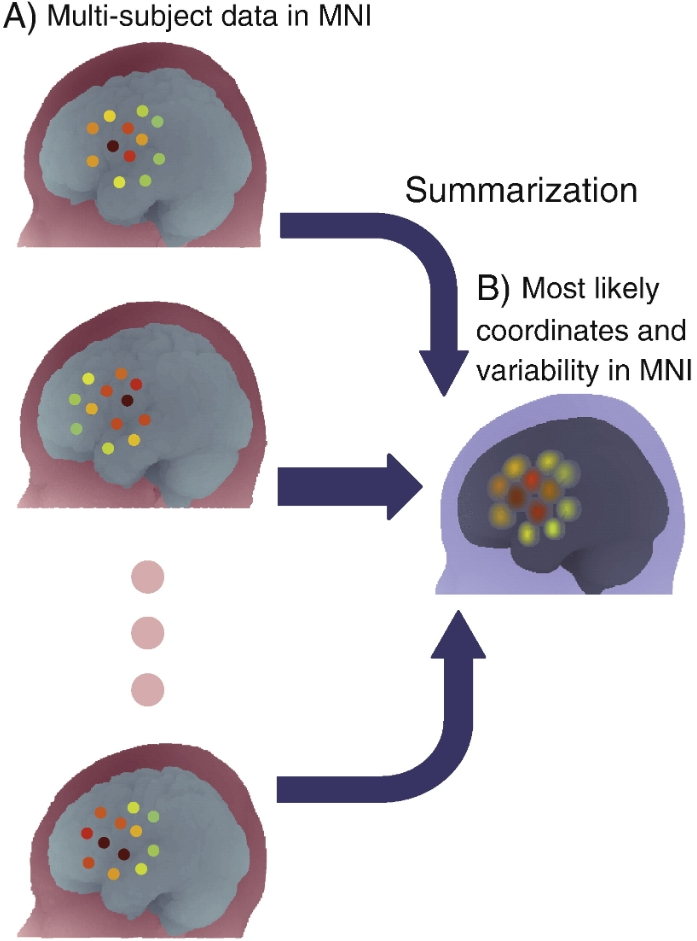
Integration of channel-based multi-subject functional near-infrared spectroscopy (fNIRS) data in MNI space. After the previously described process, each subject's channel-based fNIRS data can be presented in MNI space. By repeating this process, multi-subject data are then available in MNI space (Fig. A). These data are summarized in MNI space (Fig. B), where the coordinates of the channel positions are averaged to yield the most likely channel position (center of the circle) and the variability of the data is expressed as a composite standard deviation (radius of the circle). Colors indicate the level of activation according to the heat map chromatogram (red for higher activation, green for lower activation).
However, during the conversion process, due to individual differences, the cortical projection points of the same scalp location in the brains of different individuals will be different, which in turn generates errors. To measure the magnitude of the error, researchers commonly use statistical indicators of variability such as standard deviation or combined standard deviation (cSD) along the x, y, and z axes. In typical multichannel measurements in adults, the cSD is typically between a few millimeters and a dozen millimeters. This suggests that when channel density is low and measurements do not overlap, errors remain even though different channels can roughly correspond to individual brain gyrus or Brodmann regions.
When the number of channels increases, differences in individual head shapes and sizes can make channel placement less reproducible and channel independence difficult to guarantee. At this point, it is a feasible approach to integrate multi-channel data into the region of interest (ROI). For example, if different individuals have different numbers of channels in the left angular gyrus region, these channel data can be grouped separately to represent the functional status of the region in different individuals. This would address the issue of channel placement differences to some extent and focus more on the functional study of macroscopic anatomical regions.
For group analysis of continuous image data, the situation is more complex. Due to the different shapes and sizes of individual scalps, the shape, size and orientation of continuous image data will also vary. Although the NIRS-SPM software package can adjust the degree of data overlap, how to deal with the overlapping regions more effectively is still a topic that researchers need to explore in depth. Currently, the central region common to all subjects is usually selected for analysis to ensure the stability and comparability of the data.
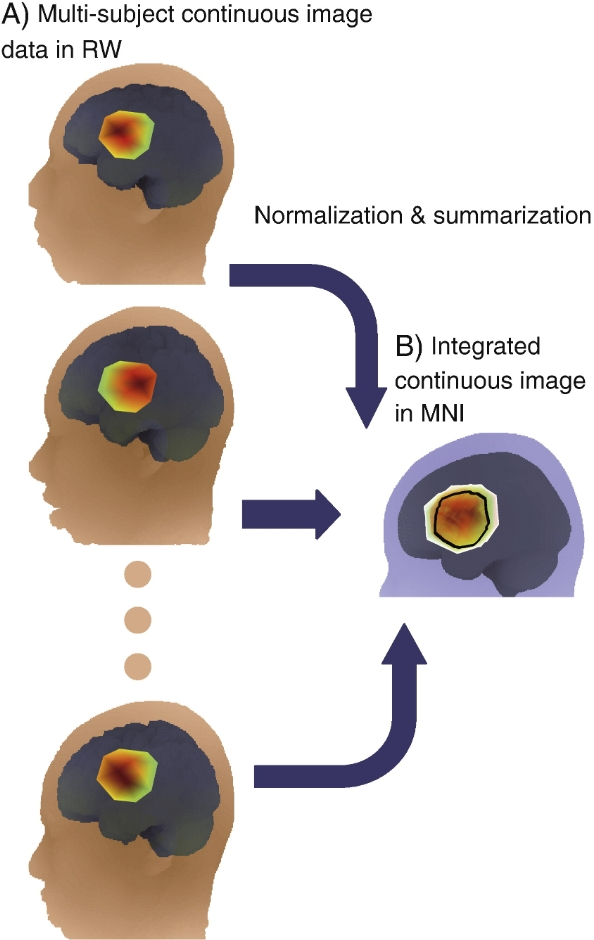
Continuous image data from functional near-infrared spectroscopy (fNIRS) were integrated in MNI space. For each subject, a continuous image was created in real-world (RW) space using interpolation or image reconstruction (Fig. A). Each image was normalized to MNI space and averaged with each other to obtain an integrated continuous image in MNI space (Fig. B). The outer edges indicate areas covered by at least one subject, and the inner black borders indicate areas covered by all subjects (15 subjects in this simulated data). Colors indicate the level of activation according to the heat map chromatogram (red for higher activation, green for lower activation).
In addition, the effective spatial resolution of continuous images in standard space is also a key issue. fNIRS data reconstructed with an effective resolution larger than the actual experimental resolution implies that functional inference will be limited by the resolution of anatomical labeling tools. Therefore, analysis by setting ROI becomes a common method to realize robust functional inference of continuous fNIRS images. Researchers can either extract voxels within ROIs based on the center coordinate values or refer to macroscopic anatomical atlases for analysis. However, it is important to note that different ways of setting ROIs will have an impact on the analysis results and need to be carefully chosen in practical applications.
VI. Probabilistic alignment: a new path to breaking through limitations
In practical studies, MRI scanners are not readily available, and the simultaneous use of fNIRS and MRI increases the cost of the experiment and puts more burden on the subjects. To solve these problems, probabilistic alignment methods have emerged, opening up new directions for spatial alignment of fNIRS data.
The probabilistic alignment method probabilistically aligns fNIRS probe or channel locations to standard brain templates with the help of MRIs stored in a reference database, rather than the subject's own MRIs. The researchers first constructed a reference database containing head and brain MRIs of multiple individuals and 10 - 20 standard positions of these individuals in MNI space.
To perform the alignment, the coordinates of the fNIRS channels on the subject's head were acquired with a 3D digitizer, and the points were marked at 10 - 20 standard positions, which were transformed to the MNI space of the reference database by affine transformation, and then the head surface points were registered to the corresponding cortical surfaces. This yields a multi-subject distribution of a given fNIRS channel on the cortical surface, as well as the most probable estimate and a cSD representing the error. cSD for this method can be controlled on the millimeter scale when the placement of the fNIRS probe on the scalp is reproducible, which is sufficiently accurate for functional mapping studies at the level of the cerebral gyrus.
Traditional probabilistic alignment methods require at least four different scalp reference marker points, but determining the fourth marker point is more difficult. For this reason, the researchers developed an anchor point-based probabilistic alignment method. The method utilizes three cranial marker points, the root of the nose and the left and right preauricular points, plus an affine transformation with an anchor point that can be obtained from any location on the scalp. A planar and spherical coordinate system is defined by the three cranial marker points, the reference point is transformed to the scalp of the reference head, and then the anchor point is transformed to the MNI space using the deformation field from the reference head to the MNI space. The experiments show that the anchor-point-based probabilistic alignment method is comparable in accuracy to the traditional probabilistic alignment method and the method based on SPM with individual's own MRI alignment, and it is easier to operate and reduces the experimental burden, which is especially suitable for clinical research scenarios.
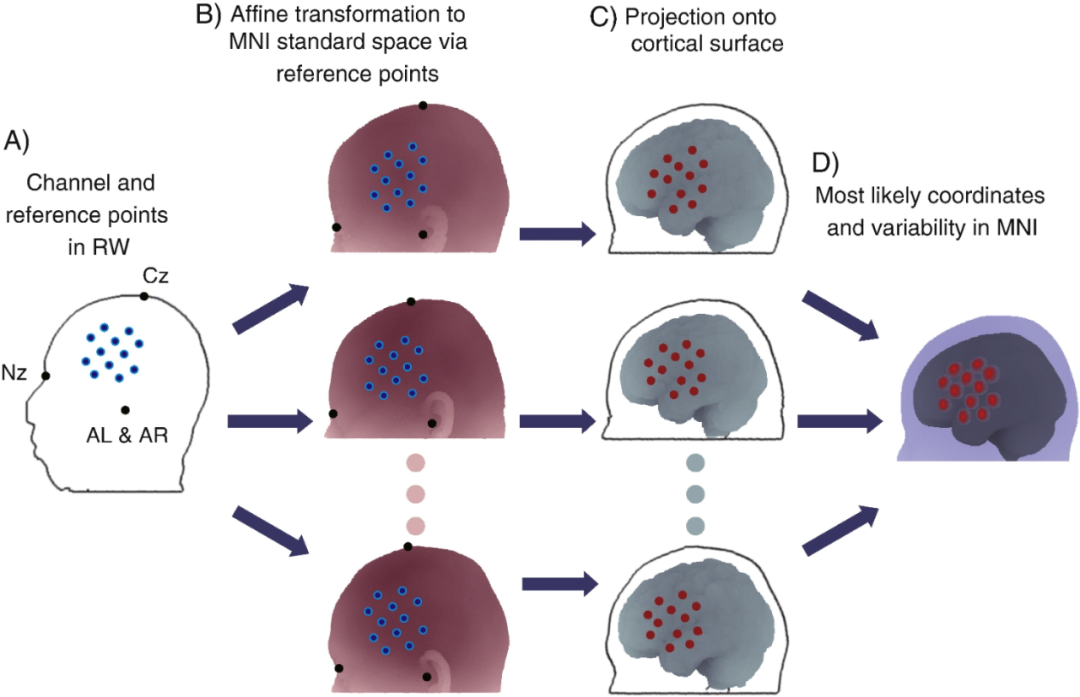
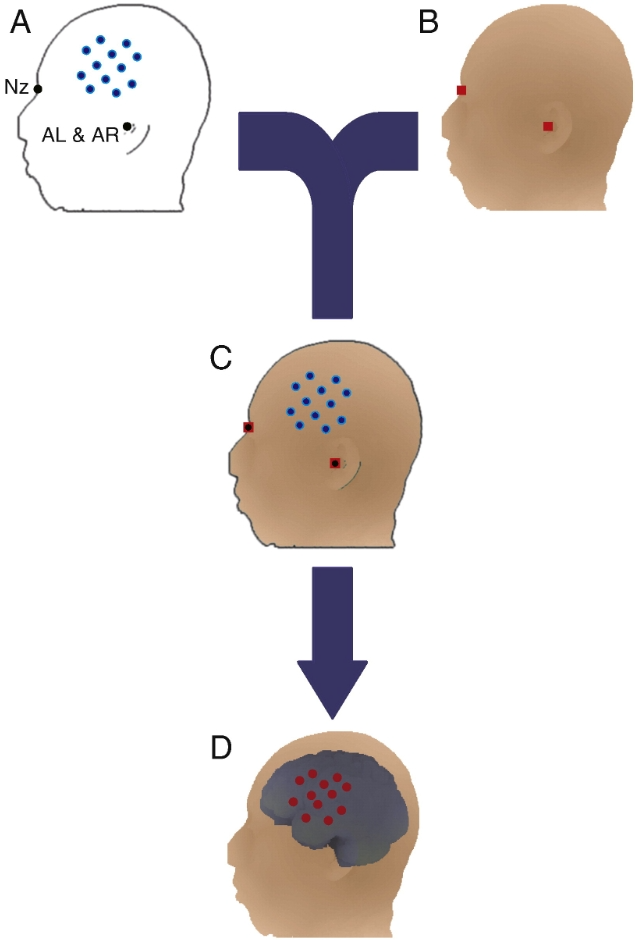
Probabilistic alignment of single-subject data without magnetic resonance imaging (MRI). (A) The locations of channels and reference points in real-world (RW) space were measured using a 3D digitizer. The minimum number of reference points is four, as in this case where the Nz (nasal root point), Cz points, and left and right anterior ear points (AL and AR) were used. Alternatively, all or selected points of the 10/20 system can be used. (B) Reference points in real-world space were transformed by affine transformation to correspond to the corresponding reference points in each entry in the reference MRI database in MNI space. (C) Projections of channels on the scalp onto the cortical surface of the reference brain. (D) The positions of the channels projected onto the cortex were integrated to derive the most probable coordinates (mean: sphere center) as well as the variability (integrated standard deviation: sphere radius) in MNI space.
VII. Probabilistic alignment in DOT: expanding the technological boundaries
Diffuse optical tomography (DOT), a tomographic variant of fNIRS, utilizes a large number of light sources and detectors to reconstruct three-dimensional images of brain activation. It provides depth resolution to distinguish between scalp and deep brain signals with increasing spatial resolution, and even allows the construction of detailed visual field retinotopic topography, which is highly promising in the study of brain function.
However, DOT usually requires subject-specific a priori information about the anatomical space of the head, which relies on structural MRI, and requires additional segmentation, alignment, and image reconstruction, which is computationally intensive and contradicts the economic convenience advantage of fNIRS. Probabilistic alignment methods provide ideas to resolve this contradiction.
The researchers attempted to replace the subject's own MRI with a standard atlas (e.g., Colin27), registered the atlas to the subject's head surface through probabilistic alignment, and then solved the photon migration positivity problem to reconstruct the optical image. Experiments showed that DOT images reconstructed using the registered atlas were similar in localizing the activation focus as those reconstructed using subject-specific brain anatomy. Although there is some localization error, it is still of practical value for inferring the level of brain gyrus. Moreover, the GPU-based Monte Carlo algorithm accelerates the photon migration simulation, making the computational cost of the atlas-based DOT technique no longer a major issue and promising a wider application.
VIII. Virtual alignment: an innovative attempt to simplify the process
Although the 3D digitizer alignment method can achieve the alignment of fNIRS channel data to the MNI coordinate space in the absence of the subject's own MRI, the method requires precise measurements of 10 - 20 marker points and probe positions, which burdens the subject and limits its application in clinical and other scenarios.
To address these issues, the researchers developed a virtual alignment method that does not require a 3D digitizer. The method replaces the direct reliance on the subject's brain by simulating the deformation of the scaffold, placing the virtual probe scaffold on the scalp, and then registering the probe and channels to a reference brain, provided that the positioning and deformation of the probe scaffold is reproducible.
The researchers first constructed a deformation algorithm for a commercial probe scaffold, then simulated the registration of the virtual scaffold on a synthetic model representing the variation in size and shape of the normal adult brain and head, and normalized the registration location to MNI space. The most probable MNI coordinate values and estimation errors were statistically estimated by repeating the simulation several times (e.g., one thousand times). Experimental results show that the standard deviation of the method is also on the order of millimeters on the scalp, achieving spatial alignment from independent fNIRS data to MNI space.
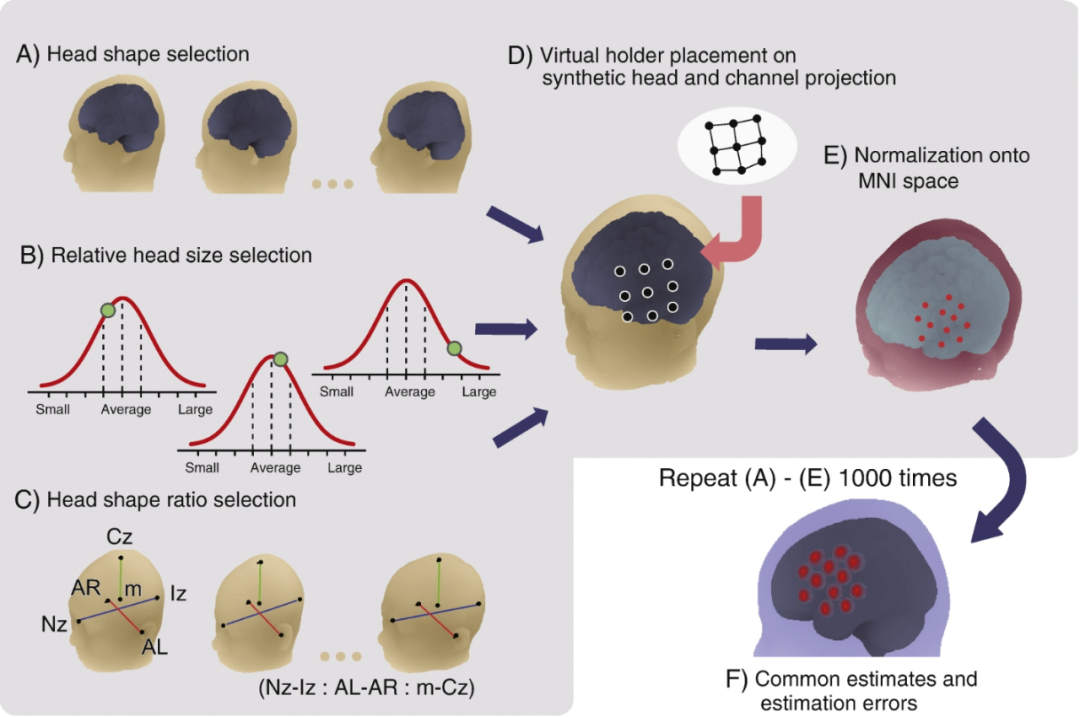
Virtual alignment of multi-subject data without magnetic resonance imaging (MRI) or 3D digitizers. A synthetic head and brain model was created by resampling the reference MRI to provide overall head and brain shape (Fig. A), relative head size (Fig. B), and head shape scale (Fig. C). In Fig. C, m denotes the anterior right ear point (AR), the anterior left ear point (AL), nose root point (Nz) and the occipital bulge (Iz) center of gravity. On the synthesized head, a virtual functional near-infrared spectroscopy (fNIRS) probe holder (Fig. D) was placed based on the assumption that the deformation and placement of the probe holder is reproducible. From the fNIRS probe (black dots in Fig. D), channels were defined as midpoints between the probes. These channels were projected onto the synthetic brain and normalized to MNI space (Fig. E). This process was repeated a thousand times to derive the most probable estimate (mean: center of the red circle) and the estimation error (integrated standard deviation: radius of the circle).
However, the method is demanding in terms of probe holder placement and shape description. To simplify the operation, the researchers created a virtual alignment library of common probe placements in adult subjects, providing MNI coordinates and macroscopic anatomical estimates for the fNIRS channel. This made it easier for researchers to use the virtual alignment method and reduced the operational difficulty.
IX. Software implementation: getting technology off the ground
As fNIRS applications become more widespread, there is a growing need for data processing software. Currently, there are three major free Matlab-based software packages that integrate probabilistic alignment tools to spatially align independent fNIRS data to MNI space.
HomER2 is an integrated fNIRS data processing tool with a user-friendly graphical user interface (GUI). It has 10 - 20 preset marker points, allowing users to easily design the probe layout through the GUI, and is also compatible with 3D digitizers for channel analysis and probabilistic alignment for reconstruction of continuous images. In addition, HomER2 provides a wealth of data processing "recipes" for flexible spatial and temporal data analysis to meet different research needs.
NIRS-SPM provides statistical parameter mapping tools for fNIRS to generate continuous image data from discrete channel data via a non-uniform spline interpolation kernel. When processing independent fNIRS data, NIRS-SPM utilizes probabilistic alignment to transform functional images into MNI space and employs a variety of statistical methods for individual and population data, providing researchers with powerful data analysis capabilities.
Platform for Optical Topography Analysis Tools (POTATo) focuses on providing flexible modulation capabilities. It does not have standardized procedures, but like HomER2 provides "cookbooks" that allow users to easily integrate new custom functions as needed. Probabilistic alignment and virtual alignment toolboxes are stably integrated into POTATo, allowing users to process channel data or continuous image data on demand for individual and group analysis.
The researchers also provide toolboxes of basic Matlab functions for probabilistic alignment on their website, making it easy for developers to integrate them into their own software packages. Users with a basic knowledge of Matlab can also use these native toolboxes directly, but for most users, it is more convenient to use the probabilistic alignment tools through the packages mentioned above.
X. Data alignment for children and infants: challenges and hopes
Alignment of child and infant data is a challenging but critical area in fNIRS research. Currently, there are no established standard stereotactic systems for processing infant brain data, but some important advances have been made in recent years.
The researchers developed probabilistic brain templates for a variety of age groups, such as templates based on MRI data from 76 9 - 15 month old infants, and specific templates for newborns to 4 year olds, infant brains at 29 - 44 gestational weeks, and 4.5 - 18.5 year olds, which allow for gray matter , white matter and cerebrospinal fluid segmentation. There have also been studies that have created average shape atlases, obtained by averaging multiple neonatal brains after aligning them to MNI space and performing iterative affine and nonlinear transformations, but the correspondence of the atlases to macroscopic anatomical structures is unclear.
Stable macroscopic anatomical segmentation is very difficult to perform before 2 years of age due to the low contrast of MRI images of neonatal and infant brains. Segmentation at the lobe level is currently only performed with some success at 2 years of age, and segmentation at the level of the brain gyrus requires further study. In practical studies, due to the lack of anatomical atlases suitable for infants and young children, researchers have attempted to extrapolate adult atlases to young brains. For example, Shi et al. created longitudinal deformation fields to convert adult brains to infant brains and projected AAL onto the brains of newborns, 1- and 2-year-olds.
The researchers also applied probabilistic or virtual alignment procedures to convert scalp fNIRS channels to cortical templates in MNI space based on the assumption that the relative macroscopic anatomical structural patterns of infants' and children's cortex are similar to those of adults and experimentally verified the macroscopic anatomical comparability of this approach. However, this method is not an optimal solution. In order to better utilize fNIRS for pediatric developmental functional neuroimaging studies, brain templates representing different developmental stages need to be established and validated and made compatible with the MNI coordinate system.
There are discrepancies in the compatibility of currently available templates with MNI space and a lack of satisfactory macroscopic anatomical mapping. In the future, there is a need to establish integration or links between different systems, and also to consider standardizing spatial data in a relative scalp coordinate system to represent scalp and cortical positions using a spherical coordinate system or the International 10 - 20 System and its derivatives, which may require manual tracing of macroscopic anatomical structures at the level of the brain gyrus, which is challenging but expected to be with the development of relevant technology substantial progress.
XI. Conclusion: technology integration for a promising future
After years of development, fNIRS technology has gained a firm foothold in the field of neuroimaging, but it also faces technical difficulties such as spatial alignment. The spatial alignment technique, as a bridge between fNIRS and other neuroimaging techniques, is of great significance in promoting the development of fNIRS and neuroscience research.
As the technology continues to advance, we have reason to believe that the spatial alignment technique of fNIRS will continue to improve. In the future, more accurate and convenient alignment methods will emerge, and there will be breakthroughs in alignment techniques for special populations (e.g., children, infants). fNIRS will integrate more closely with other neuroimaging technologies, providing us with more powerful tools to reveal the mysteries of the brain. Driven by the convergence of technologies, neuroscience research is expected to achieve more breakthroughs and bring new light to human health and cognitive development.
XII. About the author
Daisuke Seiki

Lecturer, Department of Science and Technology, Faculty of Natural Sciences, Faculty of Education and Research, Kochi University.
H-index 26, citations 4780.
Research interests: life sciences/neuroscience, computer vision.
Source:https://researchers.kochi-u.ac.jp/DET01_G01/DET01_G01View/2694
http://tsuzuki.gomen.org/
Tanichi Heita (1952-), Japanese surname of Calvin Klein

Professor, Laboratory of Applied Cognitive Neuroscience, Department of Integrated Human-Machine Engineering, Faculty of Science and Technology, Chuo University.
H-index 45, citations 11,385.
Below is information on their labs:
The Laboratory was newly established in April 2013, following the research tradition of the Laboratory of Functional Brain Science at the Autonomous Medical University and the Laboratory of Sensory and Cognitive Food Science at the National Institute of Food Research in Tsukuba, Japan. We conduct multidisciplinary research on functional brain imaging using functional near-infrared spectroscopy (fNIRS) and human cognition using psychometrics, with a special focus on the topics of "food life" and "food marketing".
In functional brain imaging, we are particularly committed to the development of spatial localization techniques for fNIRS imaging (also known as optical brain imaging or diffuse optical imaging, DOI). Several practical tools are available and results have been published in academic journals with a solid evidence base.
Another core research area of the lab is psychometrics. Why psychometrics? Because neuroimaging alone is not enough to reveal the complex structure of human cognition. We need to ask questions, collect data, and use rigorous statistical analyses to reveal the real workings of the brain. Currently, we are applying psychometric methods to the study of human "food for life" and gradually expanding to the field of overall quality of life (QoL).
As you can see from our published results, we are very open to international collaborations in any of the above research directions. If you are interested, please feel free to contact us at dan(at mark)jichi.ac.jp.
In addition, our laboratory is located in the center of Tokyo, and we warmly welcome your visit, even for a temporary appointment, which is usually no problem!
Source : https://brain-lab.jp/wp/?page_id=42
If there is any infringement, please contact us for removal!
Company Profile

Ltd. is an innovative high-tech enterprise focusing on cutting-edge technology, specializing in brain science, neural management, human factors engineering, biomechanics, anthropomorphic environments and XR simulation reality and other multidisciplinary cross-cutting fields. The company is invested by Zhongke (Guangdong) Science Group, relying on the scientific research strength of Guangdong Human Factors Technology Research Institute and Wuhan Human Factors Engineering Technology Research Institute, and has constructed a professional operation system integrating research and development, production, sales and technical service to provide customers with one-stop, high-quality scientific and technological solutions.
With excellent innovation ability, Hengbest Technology has been awarded many invention patents, software copyrights and registered trademarks, selected in many authoritative lists such as National High-tech Enterprises, and participated in the compilation of national standards and group standards. The company has been serving universities and research institutes for a long time, and has cooperated deeply with many national societies such as the Chinese Society of Ergonomics, the Chinese Psychological Society, the Architectural Society of China, etc. The company organizes and participates in more than 40 academic conferences every year to promote technical exchanges and the development of the industry.
With the concept of "Technology Empowerment, Innovation Drive", Hengzhi Technology is committed to become a leading technology enterprise in the industry, to help national scientific and technological progress and social development, and to work together with partners from all walks of life to achieve a better future of technological empowerment.


