

Part.1
introductory
![]()
Emotion as a subjective feeling cannot be defined as a single concept. However, it is feasible to qualify, contextualize, and define functionally discrete emotions (e.g., happy, sad, fearful, calm, etc.). Emotion is a psychological state that influences cognition, behavior, and even physiological responses. Therefore, emotions play an important role in interpersonal interactions. Emotion recognition has a wide range of application areas in daily life, such as human-computer interaction, education, entertainment, and clinical diagnosis. Traditional emotion recognition mainly utilizes facial expression, voice tone, etc., but it is easy to misjudge. And physiological signals can objectively reflect the emotional state of a person. Due to non-invasive and user-friendly, electroencephalogram (EEG) and functional near-infrared spectroscopy (fNIRS) have become the commonly used physiological signals related to the brain's neural activity.
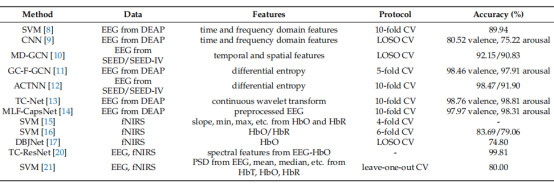
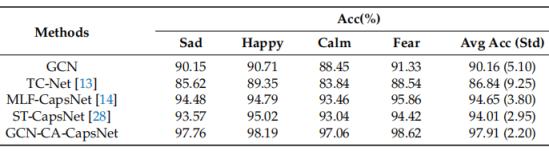
The current research on emotion recognition based on EEG/fNIRS involves both feature extraction methods and recognition models. The details are shown in Table 1 below. In addition, the proposed hybrid EEG-fNIRS can further improve the performance of emotion recognition. To comprehensively examine the efficiency of hybrid EEG-fNIRS, various deep learning algorithms have been developed to analyze the patterns of EEG and fNIRS data. In this paper, a graph convolution and capsule attention network (GCN-CA-CapsNet) model is proposed. First, the graph convolution method is used to fuse EEG and fNIRS features. Then, the capsule attention module is utilized to assign different weights to the capsule network to effectively integrate EEG-fNIRS features from different depths.
Part.2
Materials and methods
![]() ,
,
Part 2.1
EEG-fNIRS data acquisition and preprocessing
![]() ,
,
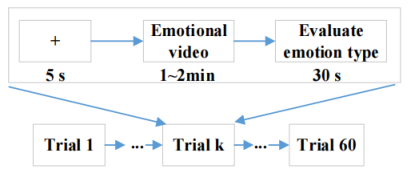
Fifty college students (25 males) volunteered to participate in this study. All subjects had normal or corrected-to-normal vision and signed a knowledgeable consent form. The subjects sat comfortably in a chair in front of a computer screen and watched 60 video clips of emotions, including sadness, happiness, calmness, and fear, with 15 video clips for each emotion. Each video lasted 1~2 min, and then the subjects filled out the assessment form within 30s. The flow of the experiment is shown in Figure 1 below.
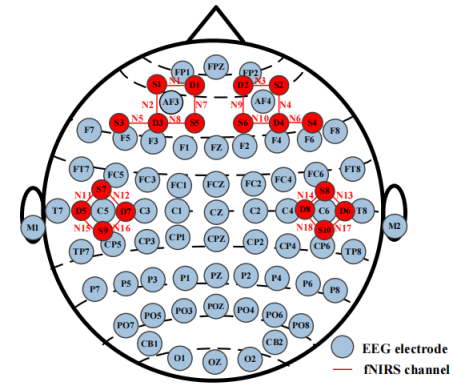
Both EEG and fNIRS sensors were placed on the subject's scalp. eEG was recorded at a sampling rate of 1000 Hz with 64 channels, and fNIRS was recorded at a sampling rate of 11 Hz with 18 channels. the EEG and fNIRS channel arrangement is shown below in Fig. 2. During the experiment, the subjects minimized head movements to avoid signal artifacts.
The raw EEG data were preprocessed using the EEGLAB toolbox in MATLAB. First, the reference was converted to bilateral mastoids and filtered using a 0.5-45 Hz bandpass filter. Then the data were segmented and baseline correction was performed at baseline 2s. Finally, independent principal component analysis was performed to remove ophthalmic artifacts.
The fNIRS data were preprocessed similarly to EEG using a 2s baseline correction with a filtering operation at 0.01-0.2 Hz bandpass filtering. The optical density was then converted to blood oxygen concentration data. Oxygenated hemoglobin (HbO) data were used and split into multiple samples.
Part 2.2
feature extraction
![]() ,
,
After preprocessing the EEG data, the differential entropy (DE) of each sample is extracted in five frequency bands: δ (0.5-4 Hz), θ (4-8 Hz), α (8-13 Hz), β (13-30 Hz), and γ (30-45 Hz).DE measures the complexity of the signal, and the expression is as follows:
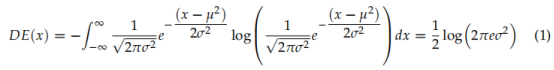
Since the fNIRS signal mainly reflects hemodynamic characteristics in the time series, for HbO data, theA total of five features, mean, variance, skewness, power spectral density (PSD) and DE, were extracted.
Part 2.3
GCN-CA-CapsNet modeling
![]() ,
,
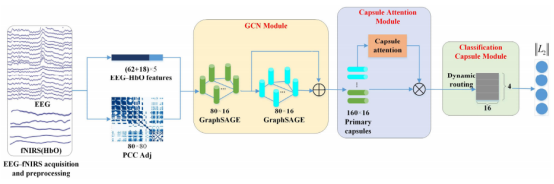
The Graph Convolutional and Capsule Attention Network (GCN-CA-CapsNet) model can be categorized into three key components: the GCN module, the capsule attention module, and the dynamic routing-based classification capsule module. This is shown in Figure 3 below.
Part 2.4
GCN module
![]() ,
,
Graph Convolutional Networks (GCN) can be used to process graph data by combining convolution and graph theory, which provides an efficient way to explore the frontal spatial relationships between multiple EEG-fNIRS channels. This module species a two-layer GCN on EEG and fNIRS feature data to generate high-level EEG-fNIRS representations.
Part 2.5
Capsule Attention Module
![]() ,
,
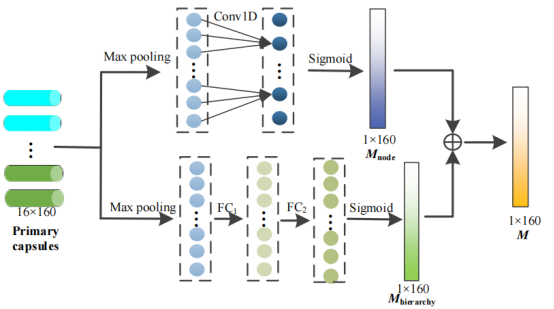
Through the capsule attention mechanism, primary capsule bodies containing features of nodes of different depths are assigned different weights, and the specific process is shown in Figure 4 below.
Part 2.6
Classification capsule module based on dynamic routing
![]() ,
,
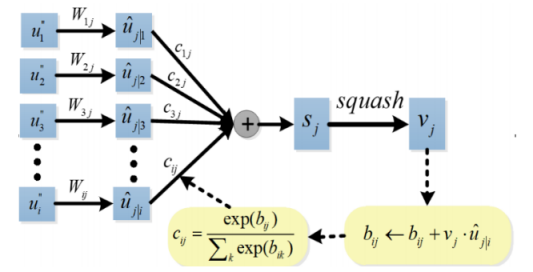
For the input and output vectors of the capsules, the lower level capsules are connected to the higher level capsules through the dynamic routing algorithm. The dynamic routing algorithm is shown below in Figure 5.
Part 3.1
Experimental setup and evaluation
![]() ,
,
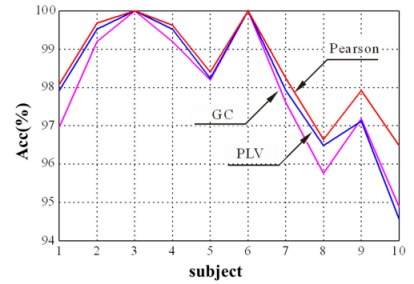
In the GCN module, Pearson correlation, PLV (phase-locked value), and GC (Granger causality) were chosen to explore the effect of the adjacency matrix on the final emotion recognition performance. The results are shown in Figure 6 below. The results show that the first 10 subjects obtained better performance when Pearson was used as the adjacency matrix compared to PLV and GC. Therefore, Pearson correlation was chosen as the adjacency matrix in this paper.
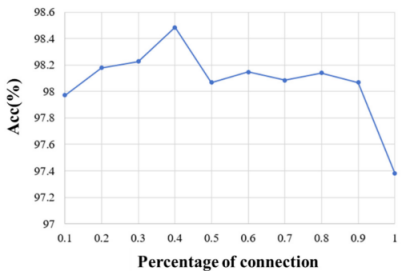
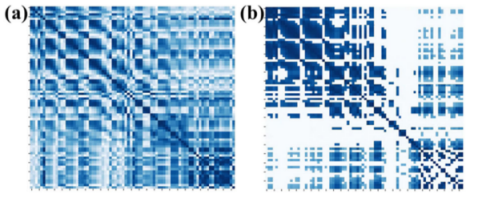
In addition, we explored the selection of 10%, 20%, etc. as well as 100% full connections in the adjacency matrix and analyzed the effect of different percentages of connections on emotion recognition performance. It is found that the best performance is obtained when 40% connections are selected. This is shown in Figure 7 Figure 8 below.
Part 3.2
Model Simplification Test
![]() ,
,
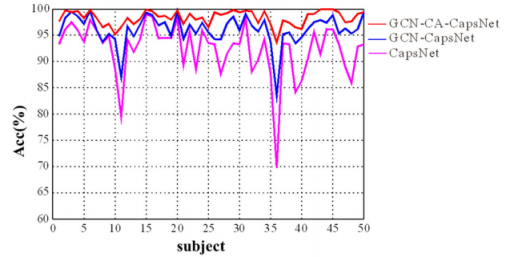
To further validate the effectiveness of each component in the GCN-CA-CapsNet framework, model simplification tests were conducted. CapsNet was considered as the baseline framework, and then GCN and CA were sequentially superimposed on the baseline framework with the aim of presenting their positive effects on emotion recognition. The results are shown in Figure 9 below, demonstrating the effectiveness of each component of the GCN-CA-CapsNet model.
Part 3.3
Performance comparison of single EEG and single fNIRS
![]() ,
,
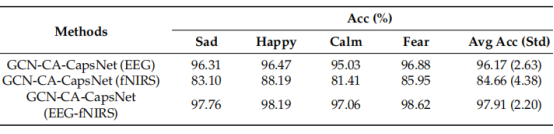
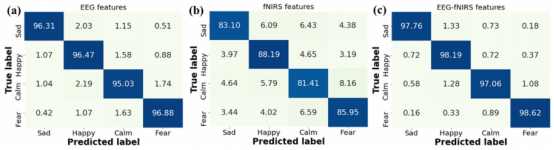
In order to verify the effectiveness of EEG-fNIRS feature fusion, a single pattern of EEG or fNIRS features was also used for emotion recognition. As shown in Table 2 below, the average recognition accuracy of the joint EEG-fNIRS features of the GCN-CA-CapsNet method outperforms the accuracy of the single features.The GCN-CA-CapsNet method can effectively fuse the EEG-fNIRS features to provide comprehensive information to improve the emotion recognition performance.
In addition, we analyzed the confusion matrix for emotion recognition with different features, as shown in Figure 10 below. The recognition accuracy of the four emotions increased when using EEG-fNIRS features compared to single EEG features and single fNIRS features.
Part 3.4
Comparison of different methods
![]() ,
,
The comparison of the proposed GCN-CA-CapsNet method with the recent deep learning methods using the EEG-fNIRS sentiment dataset is shown in Table 3 below. The results show that the GCN-CA-CapsNet method has the highest recognition accuracy among the listed methods, which is 7.751 TP3T, 11.071 TP3T, 3.261 TP3T, and 3.901 TP3T higher than the other four methods, respectively.
Part 4
Results
![]() ,
,
This paper introduces an EEG-fNIRS-based emotion recognition framework utilizing graph convolution and capsule attention network, i.e., GCN-CA-CapsNet.In addition, this paper proposes a capsule attention mechanism that assigns different attention weights to different primary capsules for feature fusion. As a result, higher quality primary capsules are selected in the dynamic routing mechanism to generate better classification capsules, which improves the recognition performance. The recognition results show that the GCN-CA-CapsNet method has better performance compared to other state-of-the-art methods, with an optimal accuracy of 97.91%.
Part 5
literatures
![]() ,
,
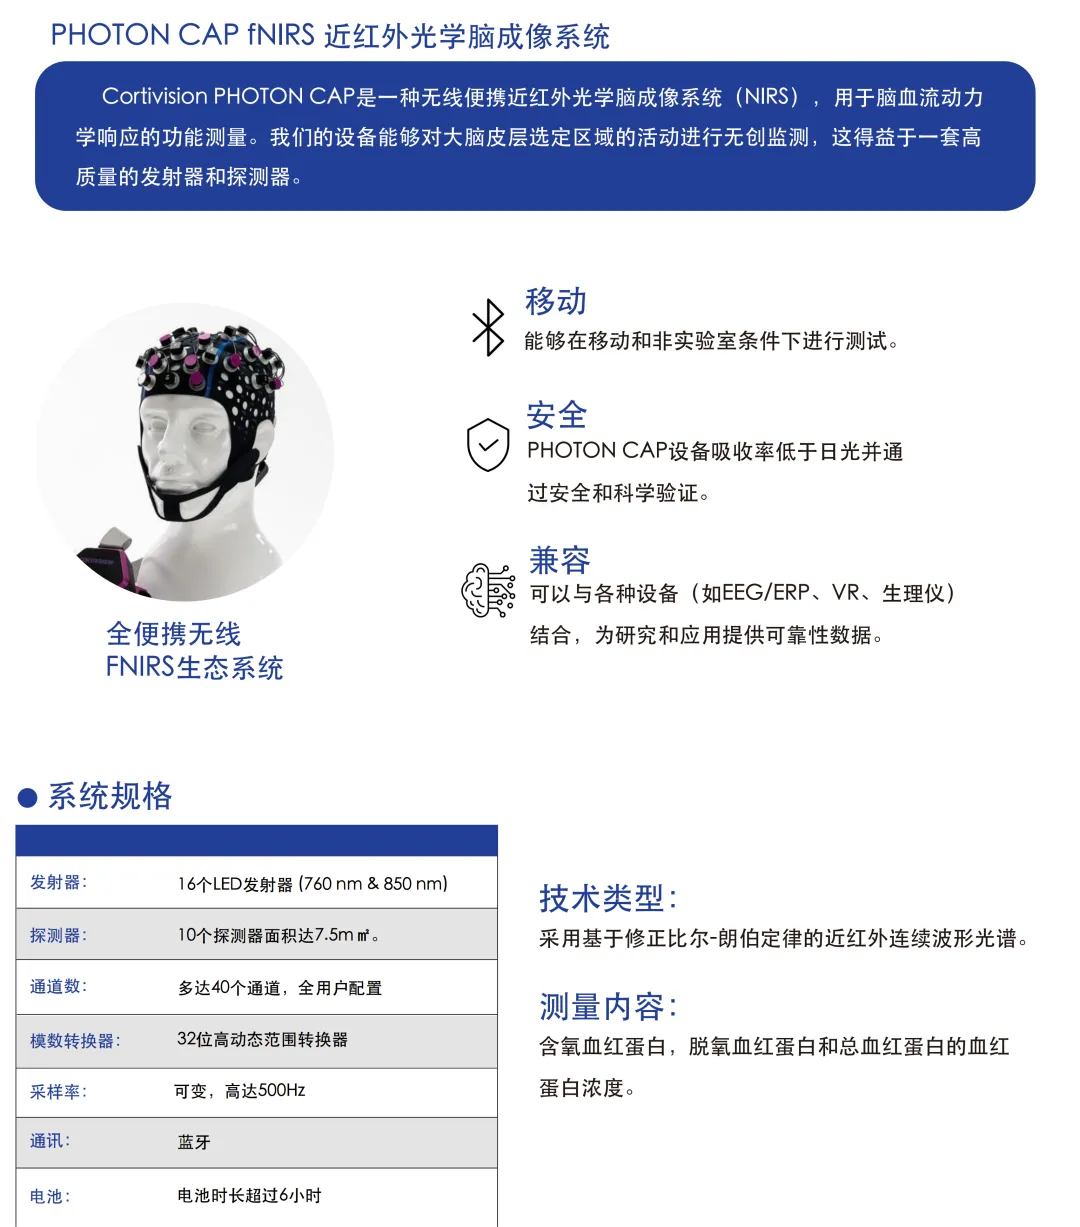
Cortivision Wireless Portable Near Infrared Optical Brain Imaging System
![]() ,
,
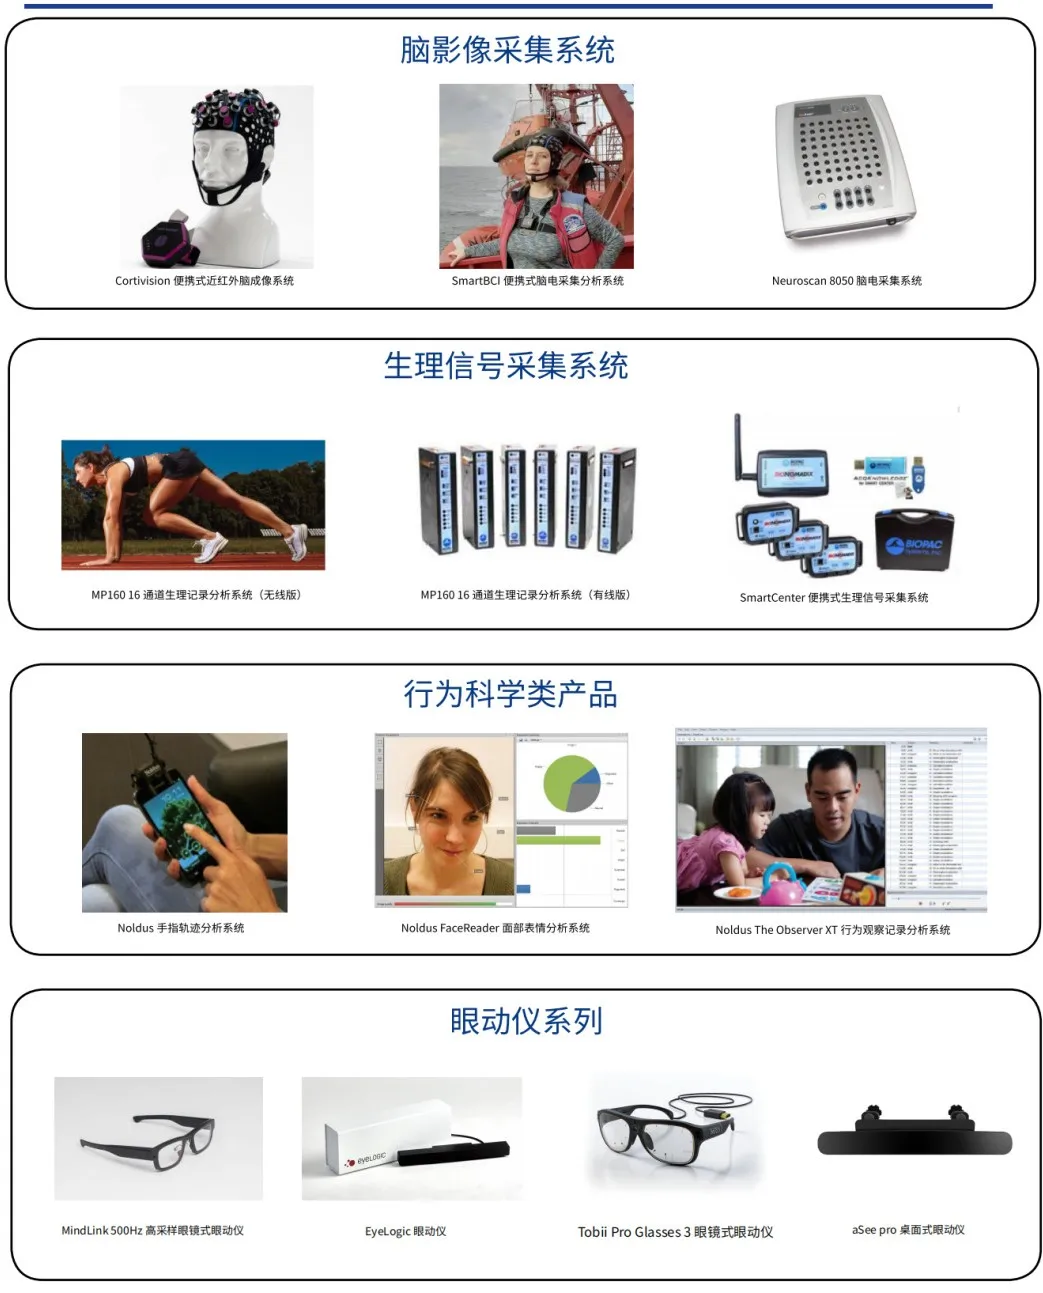
Company Profile


