Description
1、Technical Parameters
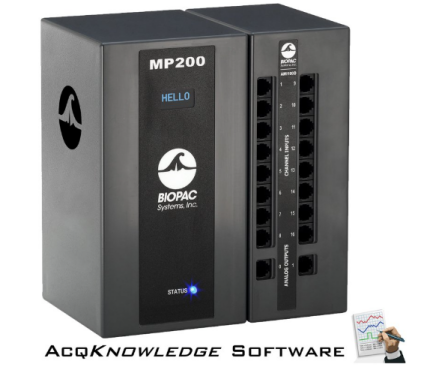
1.1, can be synchronized with the behavioral observation and analysis system real-time acquisition; comes with behavioral observation system data output module plug-ins;
1.2 The system supports the import of Noldus Observer XT data;
1.3. Support Windows/ Mac operating system;
1.4, Analog Input:
1.4.1 Number of channels: 16;
1.5, digital inputs/outputs:
1.5.1 Number of channels: 16;
1.6. analog output:
1.6.1 Number of channels: 2;
1.7. Expandable to work under MRI NMR conditions;
1.8. Connect with various amplifiers by direct plugging and unplugging without connecting cables;
1.9. The host system can be expanded to 64 channels;
1.10. Sampling rate: 1600KHZ (1.6 million points/second);
1.11 The system supports both real-time and off-line calculations;
1.12, the maximum of 60 channels display, you can choose the external trigger or internal trigger, digital filtering, can calculate dp / dt, maximum value, minimum value, average value, peak value, heart rate, slope, differential, integral, exponential operation, logarithmic operation, Fourier transform, area, deviation, standard deviation, absolute value, trigonometric function, curve smoothing, histogram, free to set the storage moment, time, repeat The number of times, available EXCEL statistical calculations, information as a WINDOWS file for long-term preservation, built-in commonly used experiments and their calculation templates and are accompanied by detailed hardware and software operating instructions.
1.13, EEG modal system
1.13.1. The data after acquisition by the software supports the selection of at least types of analysis including numerical value, spectrum, consistency, correlation, brain topography, index in the wizard mode; after acquisition of EEG data by the software, it can quickly analyze and export the derived indexes of the EEG, left marking, right marking, difference wave, maximum-minimum, minimum, maximum, average, frequency, standard deviation and so on with one key to be presented in the form of tables, charts The data can be visualized in the form of tables, charts, and topographic maps.
1.13.2 The software spectrum topography needs to support customized spectrum formula to calculate and present the corresponding results, such as: (Theta+Delta+Alpha)/(Beta1+Beta2+Gamma).

