Click on the blue word to follow us
The way used to reflect signal quality in fNIRS technology
-Scalp Coupling Index (SCI)
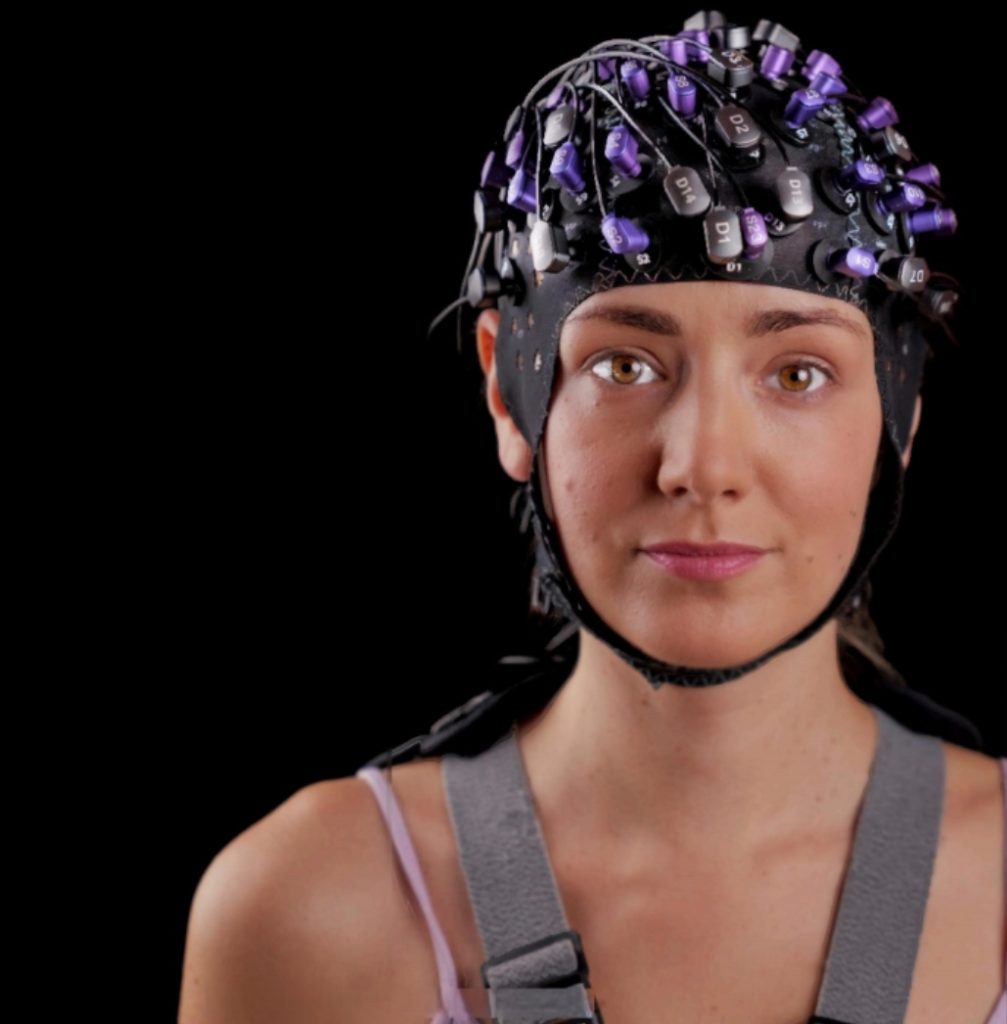
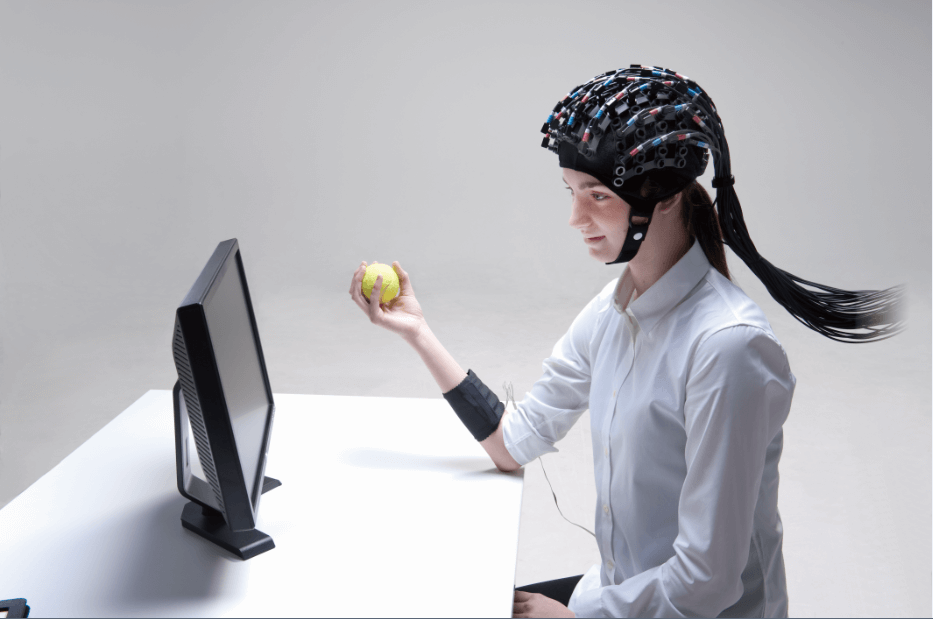
Functional near infrared spectroscopy (fNIRS) is an optical imaging technique that indirectly reflects neuronal activity by measuring changes in cortical hemodynamics associated with brain activity (Scholkmann et al., 2014). The advantages of fNIRS over other techniques for measuring brain activity are that it is safe, flexible and portable, resistant to motion interference, and cost-effective. Therefore, this imaging technique is also recognized as an emerging imaging technique with great potential for application.
However, the use of fNIRS in human subject studies is currently limited by several unresolved issues. First, there is the issue of collecting from the entire channel enough to make reliable estimates of cortical hemodynamic
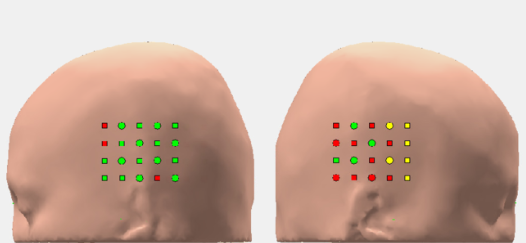
optical signals with a high signal-to-noise ratio (SNR). Second, installing a large number of optical electrodes may take a significant amount of time before the signal is formally acquired. Finally, the optical electrodes due to overly thick and dark-colored hair do not form a good coupling with the scalp, such as theFigure 1The yellow and red light poles in the
Although, the above problems can be overcome to some extent by the experience that researchers have gained in the course of long-term scientific practice. However, there is still a need to establish a quantitative method to verify the sufficient SNR before formal data acquisition to effectively manage the loss of channel signals. Therefore, a researcher has proposed a method to calculate an objective measurement of the signal-to-noise ratio (SNR) for a given fNIRS channel and to display the coupling state of individual optical poles on a human head model. This method aims to visualize which optodes need to be adjusted for better scalp coupling and to improve the SNR of the optode channels (Luca et al., 2016).
2.1 Signal-to-noise ratio of fNIRS channel
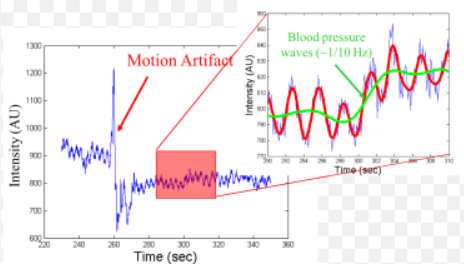
The signal-to-noise ratio of the fNIRS optical channel is closely related to the coupling of either of the two optical poles (emitter, receiver) forming the channel to the scalp. The Scalp Coupling Index (SCI ) can usually be used to reflect the SNR in fNIRS (Pollonini et al., 2014). SCI is affected by the wavelength of the NIR light used and by artifacts caused by head or jaw movements. Therefore, when calculating the SCI at a given time point, the raw signal is usually first band-pass filtered to separate the raw photodetected signal between 0.5 Hz and 2.5 Hz (corresponding to heart beats between 30 and 150 beats per minute (bpm)) from the cortical component (i.e., resting or event-related cerebral hemodynamics) and other whole-body components (i.e., respiration, Mayer waves).
The filtered signals were then normalized to their standard deviations (obtained for 𝜆1 and 𝜆2) to reject the difference between the optical power of the light sources at wavelengths λ1 and λ2 and the difference between the extinction coefficient values of oxyhemoglobin (HbO2) and deoxyhemoglobin (HbR) at the two wavelengths. Finally, the SCI was calculated as the zero-lag cross-correlation between the normalized signals, i.e., SCI = 𝜆1⨂𝜆2.
2.2 Graph-based optical topology layout
An fNIRS channel with a high signal-to-noise ratio consists of two optodes in good contact with the scalp. In contrast, if either or both of the two optodes are separated from the scalp, a channel with a low signal-to-noise ratio is formed and makes it impossible for the researcher to determine which optode needs to be adjusted in order to regain a high signal-to-noise ratio.
The relationship between the signal-to-noise ratio of a single optical channel and the scalp coupling of its two contributing lights can be mathematically modeled by the Boolean Equation (BoE) O1∧O2 = W1,2, where O1,O2 denotes the Boolean coupling state of the two optical poles (i.e., 0 = uncoupled, 1 = coupled), and W1,2 is a Boolean value that denotes whether or not the SNR of the channel is higher than some set threshold (i.e., W1,2 = 1 if SCI > 0.8, otherwise W1,2 = 0). If the measured SNR is high enough (w1,2= 1), the equation consists of the pair (O1,O2) = (1, 1) indicating that both optical heads are in good contact with the scalp, compared to W1,2= 0 which produces three possible solutions (0, 0), (0, 1) and (1, 0).
This single-channel Boolean model can be extended to the photopole layout of fNIRS. For example, by setting up a system of equations P: Oi∧Oj=Wi,j,i and j denote the emitter and detector poles that are paired, and P denotes a photopole channel formed by i,j, the coupling states of all the photopoles to the scalp can be obtained by solving the unknown N-element system of equations (O1...Oi,Oj...On). The goal of this algorithm is to iterate a process of measuring Wi,j from the optical signals collected during the wearing of the fNIRS photopoles and subsequently solving the Boolean system (O1...Oi,Oj..., ON) in real time, in order to continually reflect back to the researcher that those photopoles that have a worse scalp-coupling state (Oi = 0) and need to be adjusted are Which.
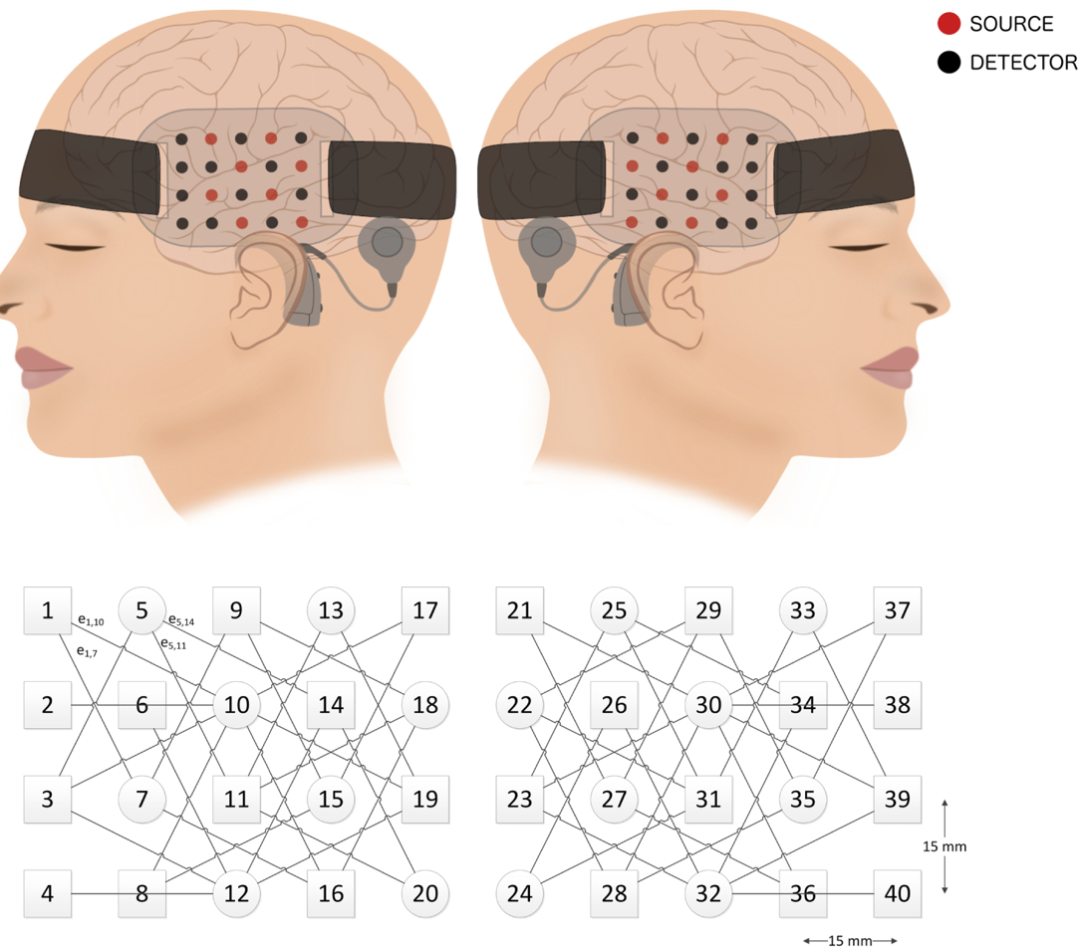
In order to formulate the Boolean system and implement its numerical solution, we propose to model the optical layout of any particular fNIRS headpiece using a connectivity graph, where the N nodes represent the optical poles (regardless of whether they are light sources or detectors), using a matrix representation, where the topological graph is described by the binary adjacency matrix E (of size N x N) representing the edges existing between the two nodes i and ji,j, and the SNR of the fNIRS channel is described by a binary weight matrix W (size N x N), where Wi,j= 1 if the SNR is acceptable and Wi,j= 0 otherwise.Figure 3For an example of graphic modeling, theFigure 4The flow of the algorithm is shown in detail
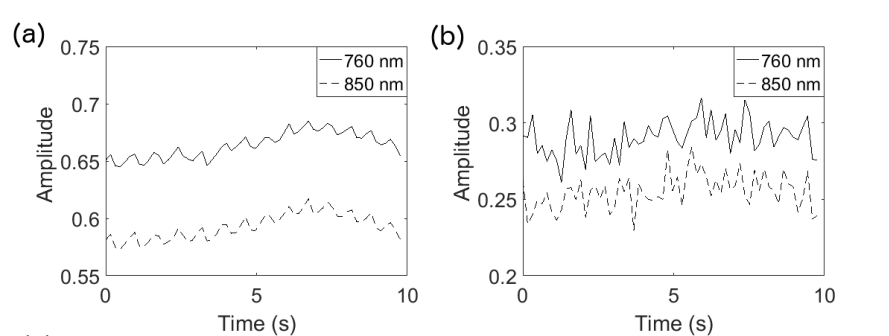
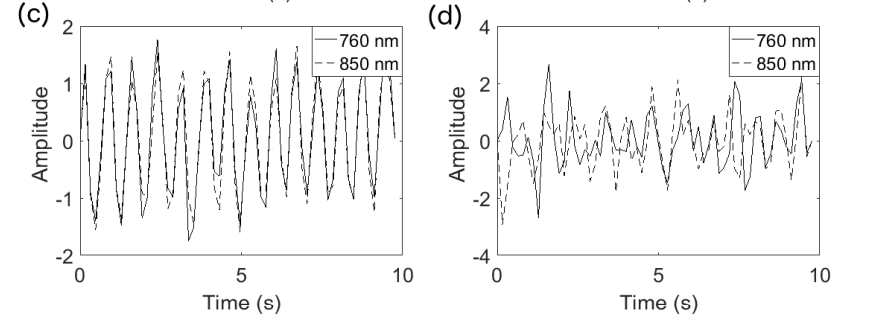
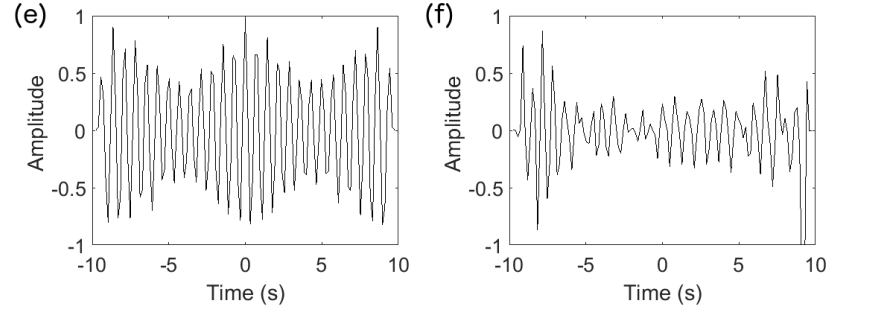
In order to verify the validity of the above method of measuring SNR, the researchers demonstrated noiseless and noisy optical signals measured at the subject's head before filtering, after normalization, and after cross-correlation, such asFigure 5: The
(a) and (b) are the raw signals of the optical pole channel without/with noise
(c) and (d) are the optical channel signals without/with noise after being normalized
(e) and (f) are cross-correlation signals for the noiseless/noisy optical channel
It is worth noting that the SCI has a value close to 1 in the noisy optical channel, while in the noisy optical channel the SCI is about 0.23
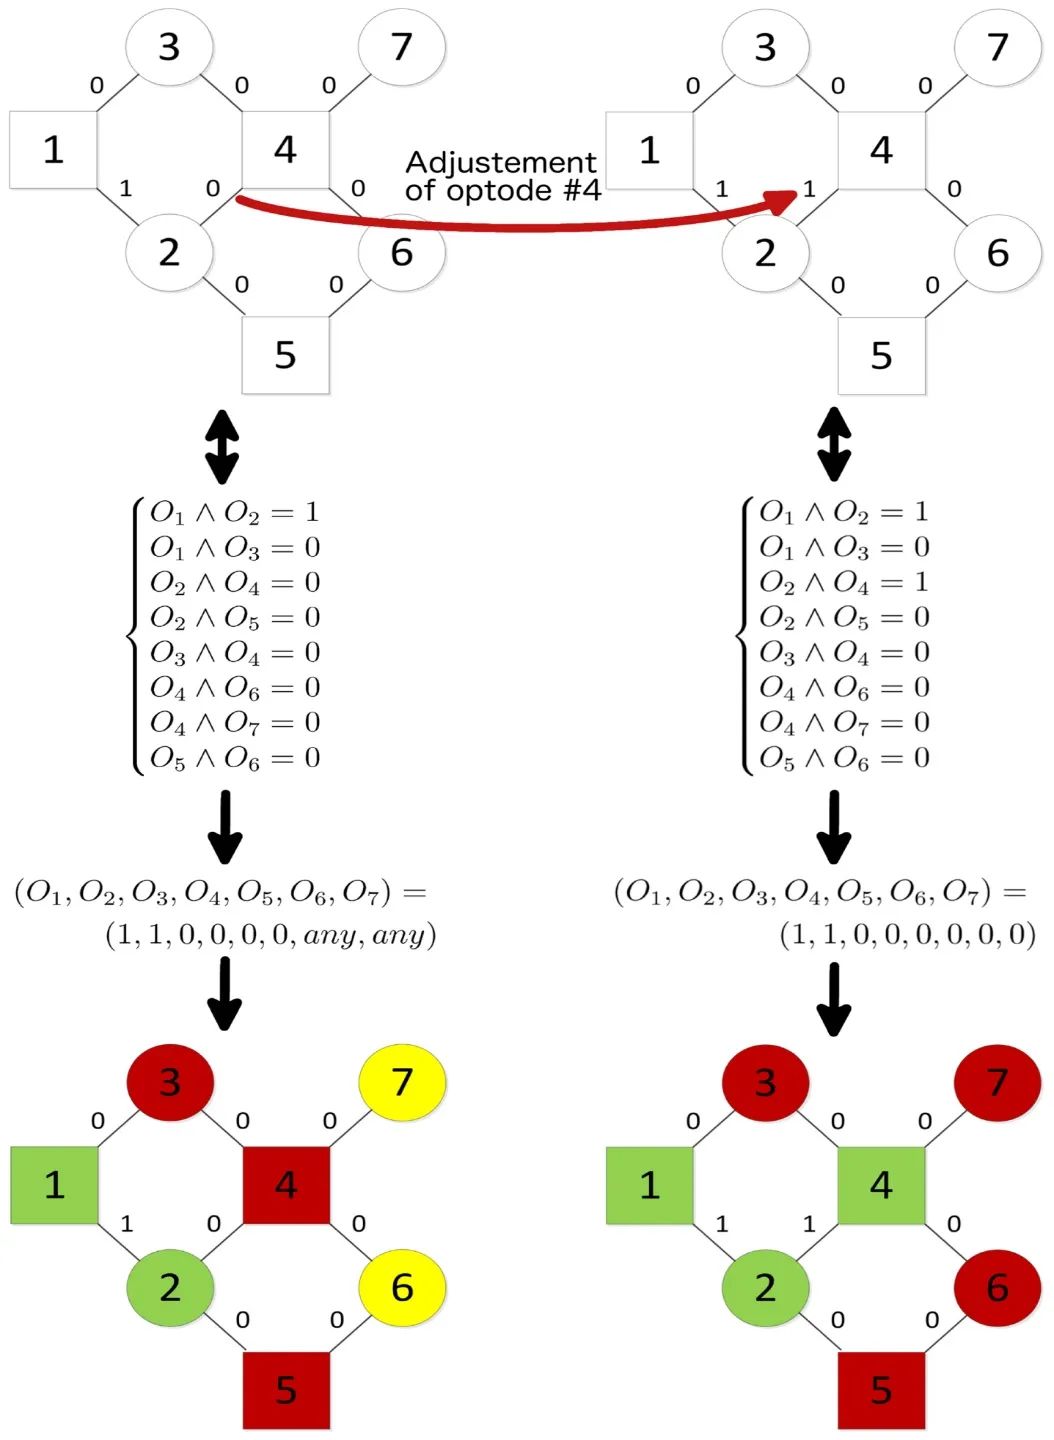
Once the SNRs of all optical channels relevant to the experiment have been examined, the scalp coupling of each optical pole can be determined by applying the iterative graph-based algorithm described in the Methods section. To demonstrate its effectiveness, the researchers used as an example a graph with 4 light sources and 3 detectors numbered from 1 to 7 as a basis for adjusting an optode when the corresponding Boolean system of equations converges to a unique solution. Initially, it was assumed that only one channel had a sufficient SNR (W1,2= 1, theFigure 6 (top left), the resulting system of equations is solved by multiple 7-tuples (1, 1, 0, 0, 0, any, any, any), where O1,O2,O3,O4,O5 have a single coupled state (1 indicates coupled (green node), 0 indicates uncoupled (red node)) and O6 and O7 indicate undetermined (yellow nodes) (Fig. 6, bottom left). The updated SNR configuration (W2,4= 1) produces a Boolean system that is uniquely solved by a 7-tuple (1, 1, 0, 1, 0, 0, 0) in which the coupling of photopoles O6 and O7 is no longer undetermined (O6=,O7= 0, Fig. 4, center and lower right). Finally, the researcher can proceed to tune the remaining uncoupled photopoles O3,O5,O6,O7.Thus, the optimal placement strategy starts by tuning those photopoles that produce an uncoupled state with the undetermined photopoles.
In conclusion, it is very important to verify that the coupling between the light detector and the scalp is good before the experiment starts collecting data, because this greatly affects or even determines the signal quality or data quality of the experiment. Therefore, if some kind of software can be used to display the scalp coupling status of each optical pole, it can help the experimenter to visualize which optical poles need to be manually adjusted before the experiment to obtain the optimal placement, so as to prepare for the collection of high-quality signals before the experiment.
The method described in this paper can have been implemented in graphical user interface (GUI) software called Placing Headgear Optodes Efficiently Before Experimentation (PHOEBE), which displays the state of scalp coupling of all optodes in real time as optical measurements are collected by the fNIRS instrument .
Downloaded from GitHub - lpollonini/phoebe: PHOEBE (Placing Headgear Optodes Efficiently Before Experiment) is a MATLAB GUI application that measures and displays the optical coupling between fNIRS optodes and the scalp of a subject in real time.
Scholkmann, F., Kleiser, S., Metz, A. J., Zimmermann, R., Mata Pavia, J., Wolf, U., & Wolf, M. (2014). A review on continuous wave functional near-infrared spectroscopy and imaging instrumentation and methodology. NeuroImage, 85 Pt 1, 6- 27. https://doi.org/10.1016/j.neuroimage.2013.05.004
Luca Pollonini, Heather Bortfeld, and John S. Oghalai, "PHOEBE: a method for real time mapping of optodes-scalp coupling in functional near-infrared spectroscopy," Biomed. Opt. Express 7, 5104-5119 (2016) https://doi.org/10.1364/BOE.7.005104
Pollonini, L., Olds, C., Abaya, H., Bortfeld, H., Beauchamp, M. S., & Oghalai, J. S. (2014). Auditory cortex activation to natural speech and simulated cochlear implant speech measured with functional near-infrared spectroscopy. hearing research, 309, 84-93. https://doi.org/10.1016/j.heares.2013.11.007
Beijing Everloyal technology co., LTDIt is a new type of high-tech enterprise based on psychological human factors, driving human factors, biomechanics, user experience, virtual reality and other directions, integrating production, research and development, sales and technical services, and has been successfully selected for the list of high-tech enterprises in Zhongguancun.
The driving human factors system, virtual reality graphical editing software, light environment psychological assessment system and psychological and human factors experimental teaching system developed by Hengzhi Technology have entered the domestic market.
As the sole agent of Poland Cortivision NIR, Russia Mitsar EEG in China, the sole agent of Italy BTS surface EMG and other biomechanical and gait analysis products in China, and the sole agent of Netherlands Noldus Behavioral Science, Sweden Tobii Eye Motion Instrument, Netherlands MindMedia Physiology and Biofeedback, US Biopac Physiology, US ETT The domestic licensed agent of products such as olfactory/taste stimulator. The high-tech products operated have served the top universities and the highest level of scientific research units in China, including Tsinghua University, Beijing Normal University, Northeast Normal University, Yanshan University, Qiyuan Laboratory, Xi'an University of Architecture and Technology, Northwest Agriculture and Forestry University of Science and Technology, Shenzhen University of Technology, Xi'an University of Science and Technology, Shanghai University, the Second Institute of Aerospace, 27 and 28 of China Electronics Technology Group, while providing technical support for ink Netease, Huawei technology to provide technical support, in the field of talent training, scientific research cooperation, transformation of results and other scientific and technological areas of continuous in-depth cooperation.
This article comes from the WeChat public number: EVERLOYAL


