


fNIRS Classical Experimental Design - Block Design
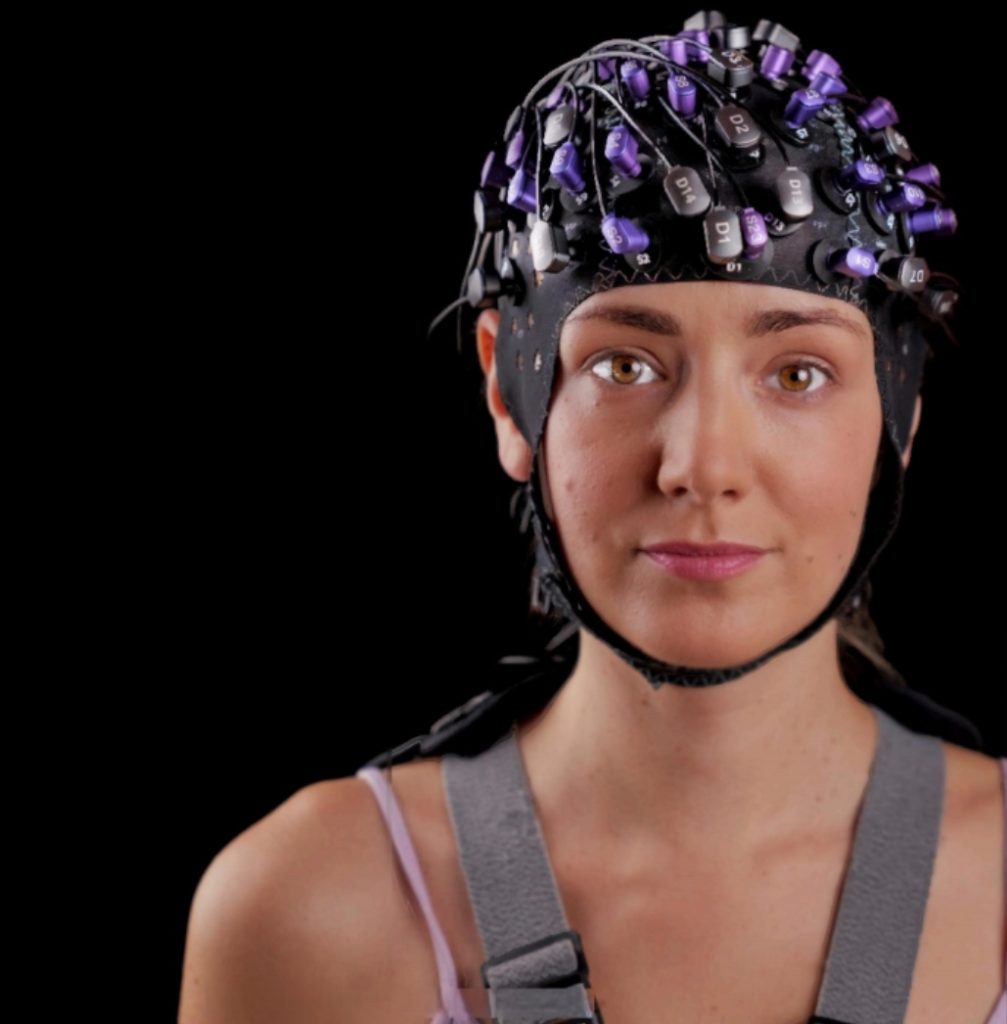
1. fNIRS experimental stimuli for Block presentations
Figure 1
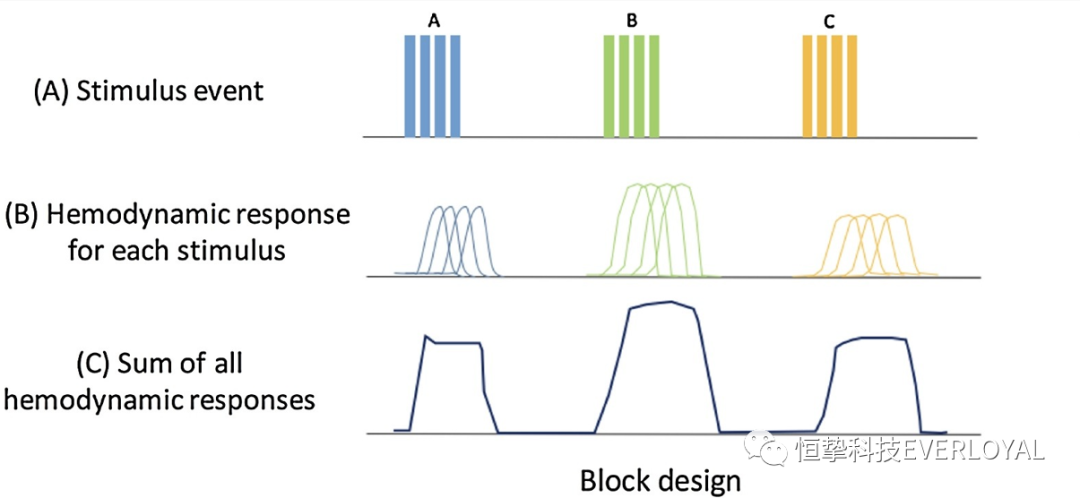
Time
2. Block Design Case Sharing
2.1 Emotion Modulates Activation in Auditory Cortex-an fNIRS Study
Figure 2
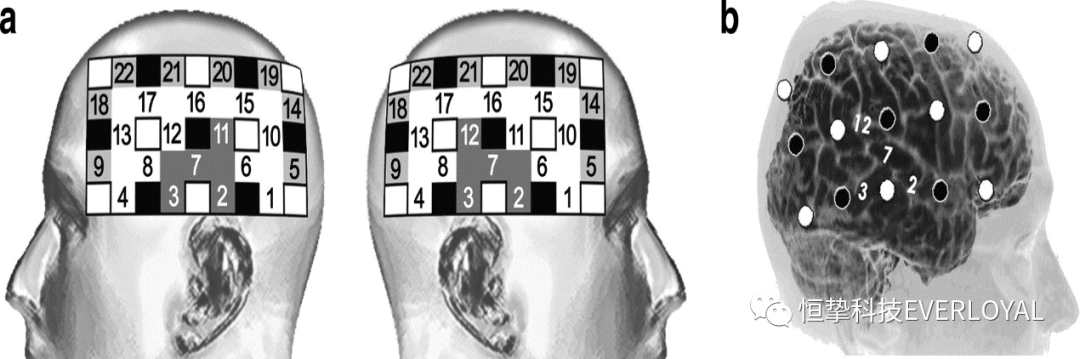
Figure 3
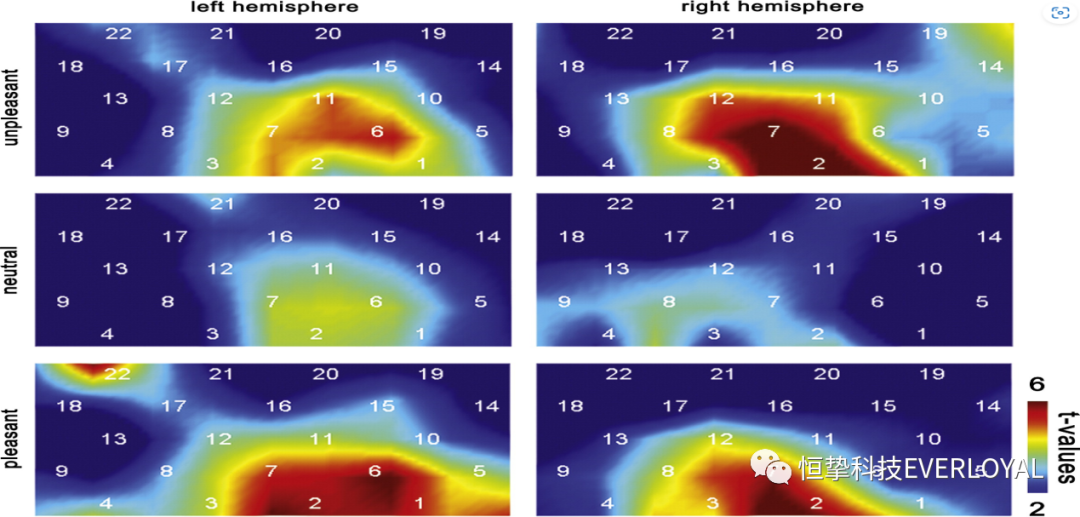
Figure 4a
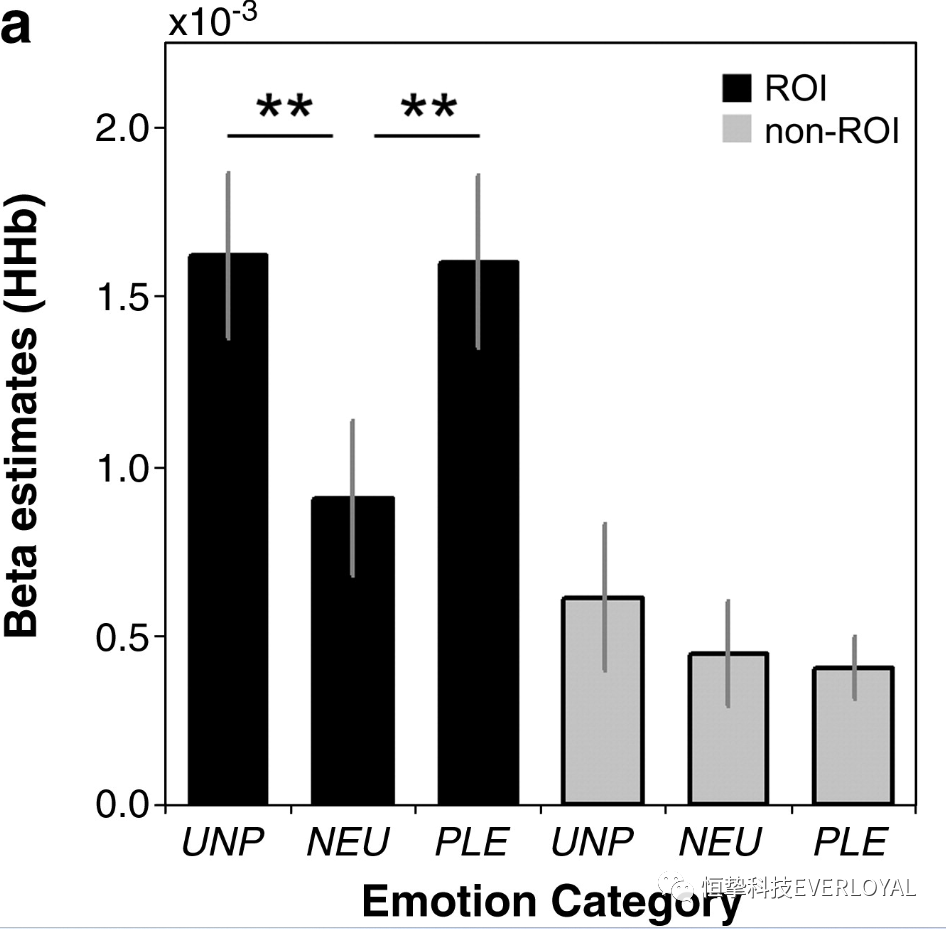
Figure 4b

Left temporal Right temporal
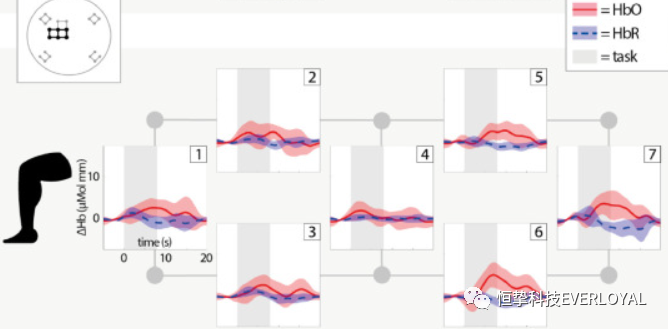
2.2 Measuring hemodynamic responses to leg activity using fNIRS
Figure 5

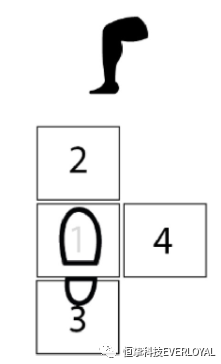
Figure 6

Figure 7
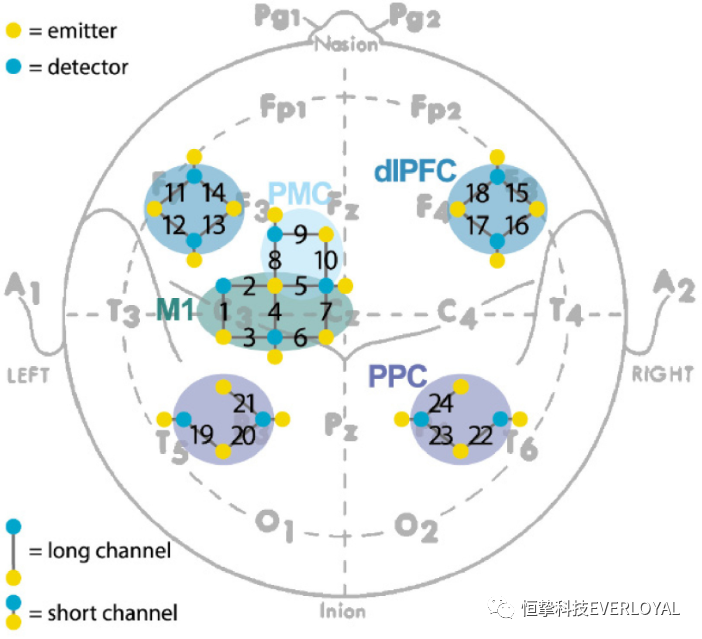
Figure 8
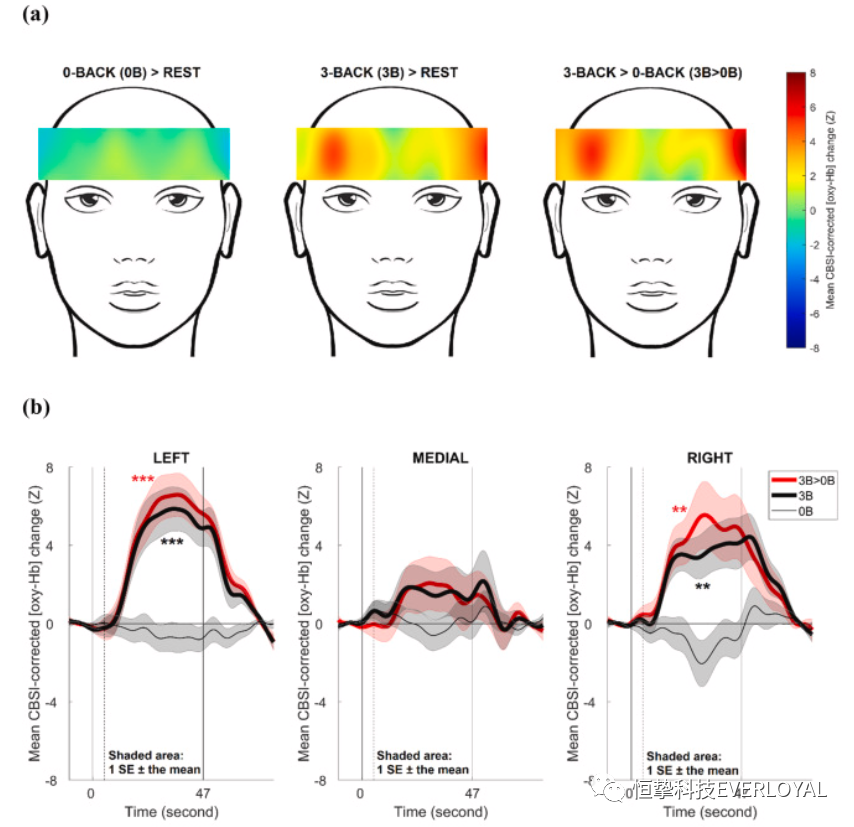
2.3 Detecting prefrontal activation during task execution using fNIRS
Figure 9
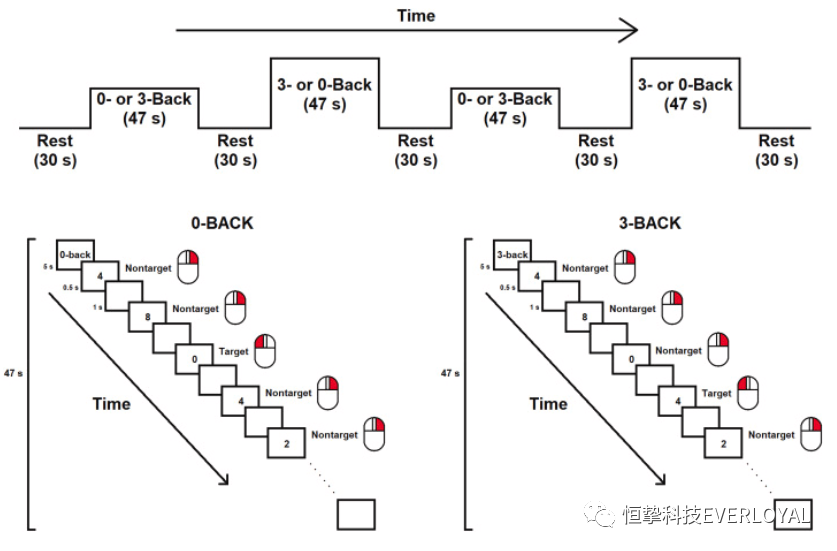
Figure 10
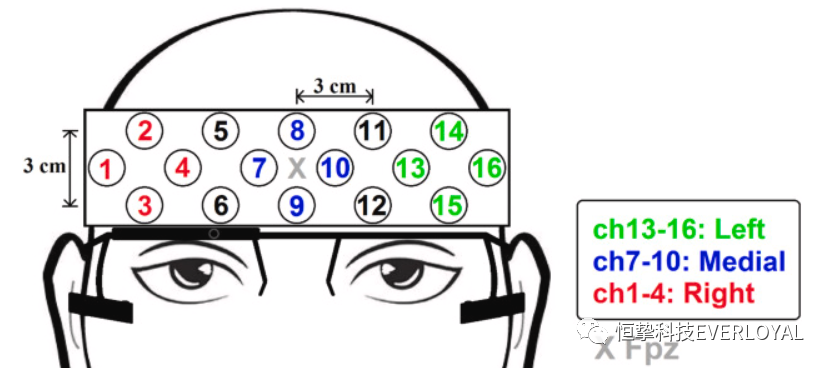
Figure 11
3. Conclusion
Reference List

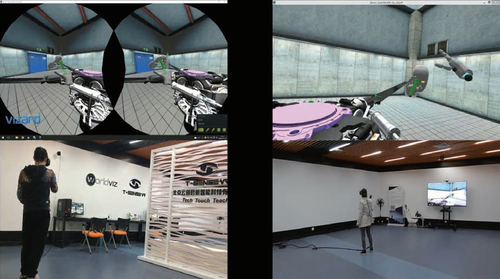
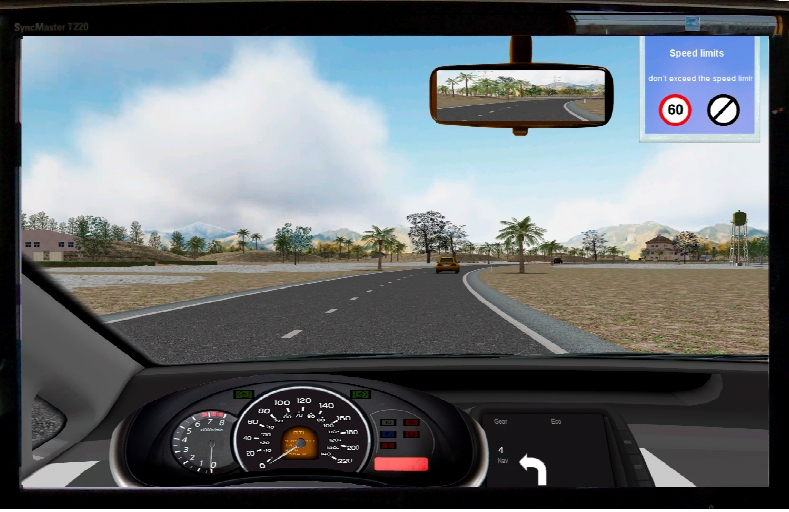
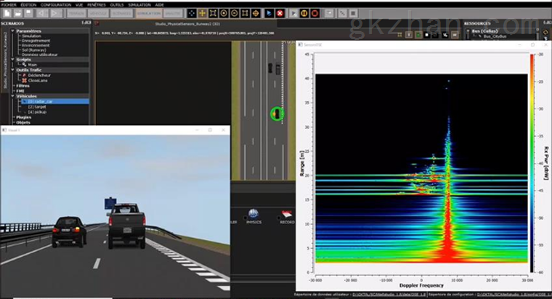
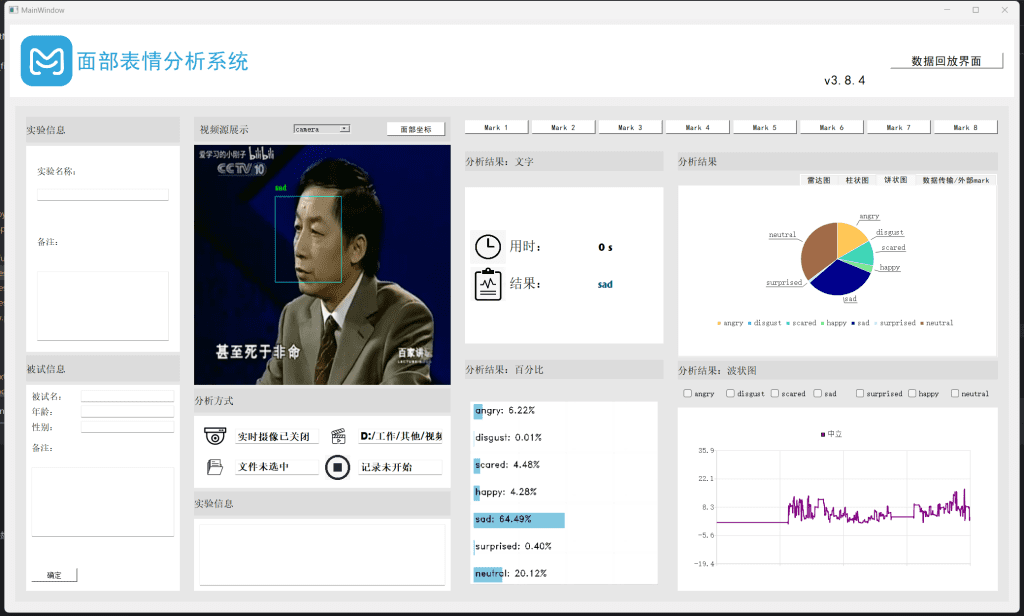
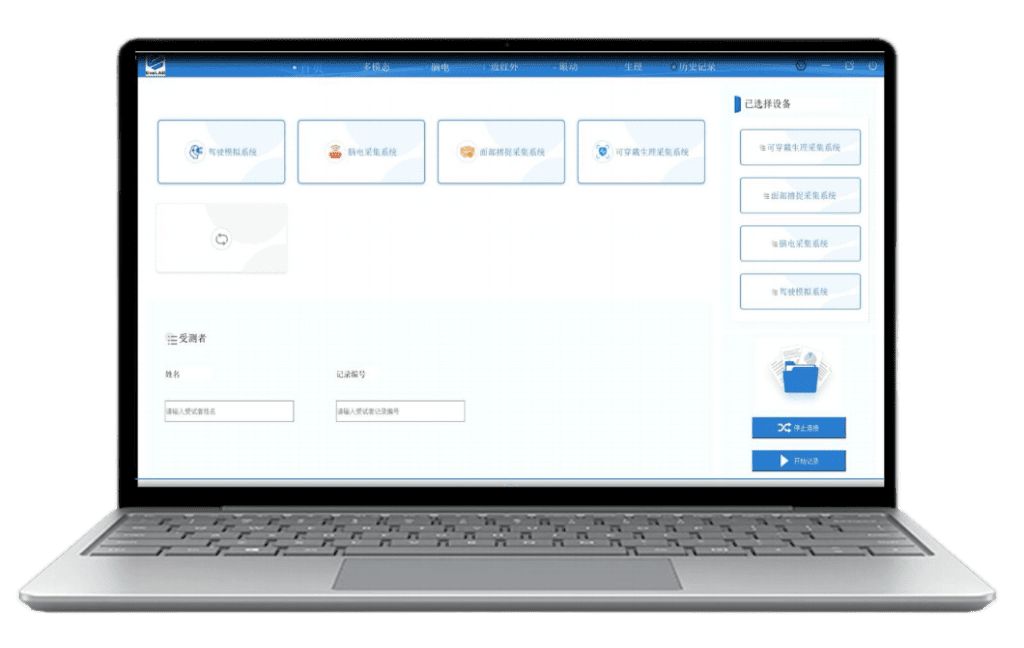
The driving human factors system, virtual reality graphical editing software, light environment psychological assessment system and psychological and human factors experimental teaching system developed by Hengzhi Technology have entered the domestic market.
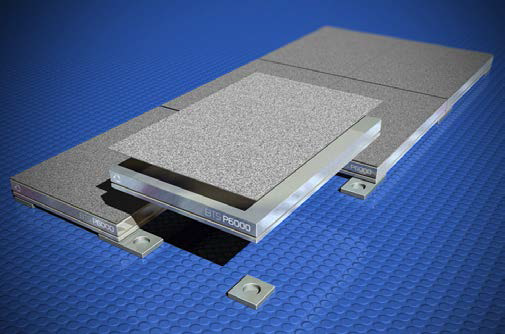
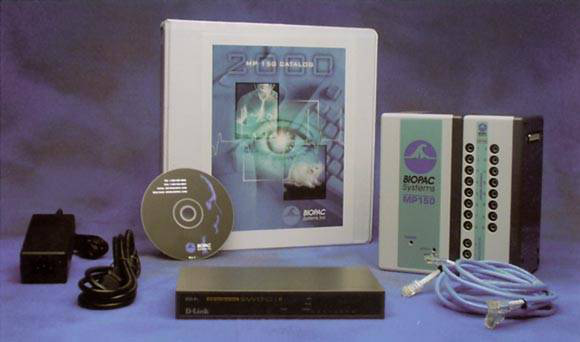
As the sole agent of Poland Cortivision NIR, Russia Mitsar EEG in China, the sole agent of Italy BTS surface EMG and other biomechanical and gait analysis products in China, and the sole agent of Netherlands Noldus Behavioral Science, Sweden Tobii Eye Motion Instrument, Netherlands MindMedia Physiology and Biofeedback, US Biopac Physiology, US ETT The domestic licensed agent of products such as olfactory/taste stimulator. The high-tech products operated have served the top universities and the highest level of scientific research units in China, including Tsinghua University, Beijing Normal University, Northeast Normal University, Yanshan University, Qiyuan Laboratory, Xi'an University of Architecture and Technology, Northwest Agriculture and Forestry University of Science and Technology, Shenzhen University of Technology, Xi'an University of Science and Technology, Shanghai University, the Second Institute of Aerospace, 27 and 28 of China Electronics Technology Group, while providing technical support for ink Netease, Huawei technology to provide technical support, in the field of talent training, scientific research cooperation, transformation of results and other scientific and technological areas of continuous in-depth cooperation.

This article comes from the WeChat public number: EVERLOYAL


