Reliability and validity analysis
The study first examined the reliability and validity of the measurement instrument of the questionnaire:
reliability analysis
Cronbach's alpha coefficient was used to assess the internal consistency of the scale and the results:
The alpha coefficients of all question items measuring perceived risk and willingness to buy were >0.7, indicating good internal consistency and high questionnaire reliability.
validity analysis
The applicability of factor analysis was assessed by KMO test and Bartlett's spherical test:
The KMO value of 0.828 (>0.7) indicates that the correlation between the questionnaire questions is high and suitable for factor analysis.
Bartlett's test of sphericity resulted in a p-value of 0.000, significance
From this, it can be judged that the reliability of the questionnaires used in the experiment are all high and the measurements are credible.
correlation analysis
Using Spearman and Kendall tau correlation coefficients, the relationship between price-perceived risk and willingness to buy was investigated:
The relationship between price-perceived risk and discount type:
Correlation coefficient: -0.104 (p)
It indicates that the type of discount is significantly, but weakly, correlated with consumer perceived risk.
The relationship between perceived price risk and consumers' willingness to buy (more critical):
Correlation coefficient: -0.518 (p)
That is, the higher the perceived price risk to the consumer, the significantly lower the willingness to buy.
one-way analysis of variance (ANOVA)
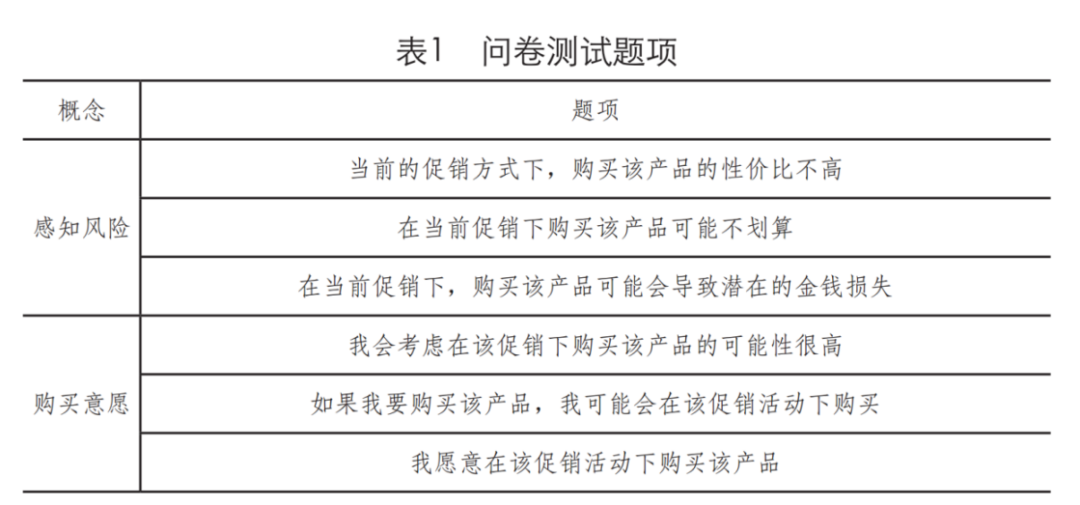
One-way ANOVA was used to test the effect of different promotional methods (discount vs. sale) and price display methods (original price vs. after discount) on perceived risk and purchase intention:
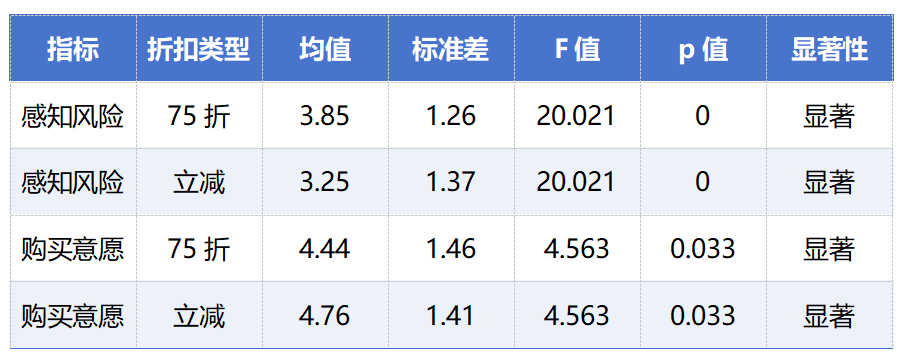
(1) Where the price is shown at the original price:
Discounts (e.g., 25% off) significantly increase risk perception more than risers when the original price is marked,
Reduced willingness to buy
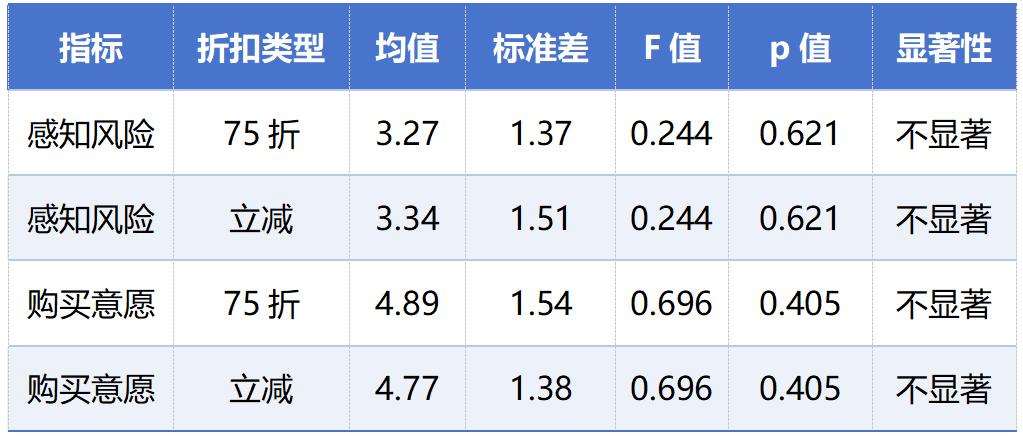
(2) Where the price is shown at a discounted price:
When discounted prices are explicitly shown, the effect of differences in promotion type on both perceived risk and purchase intentions is not significant
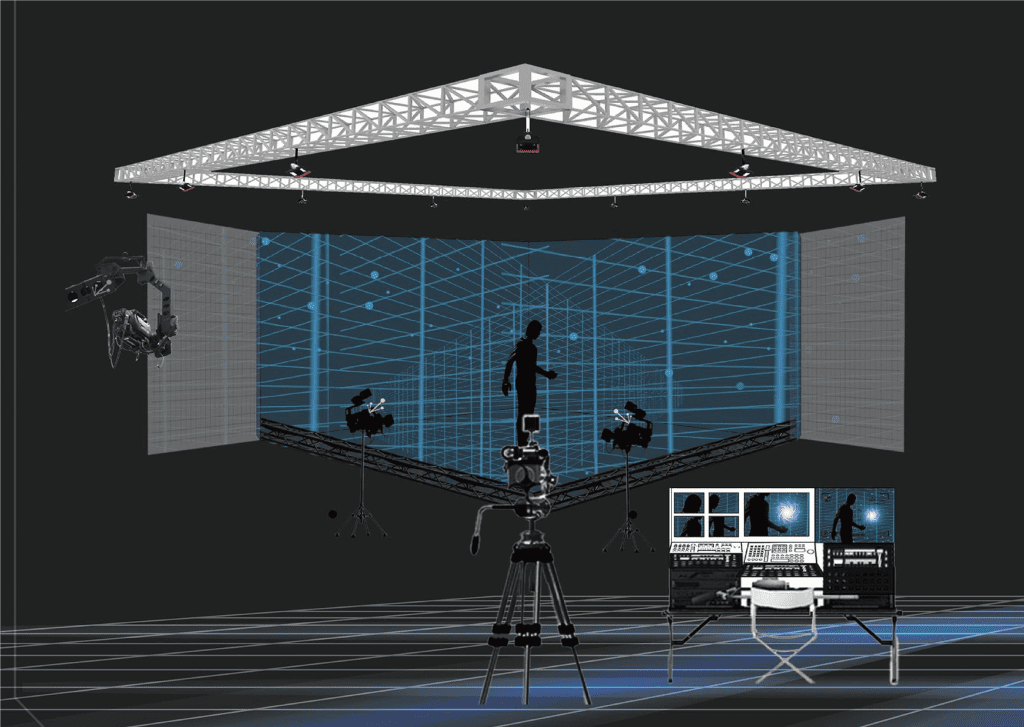
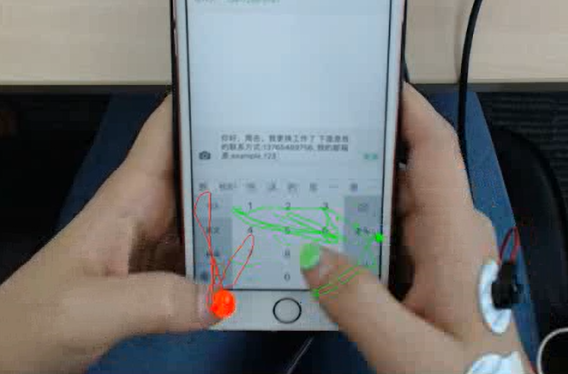
Eye movement data analysis and regression analysis
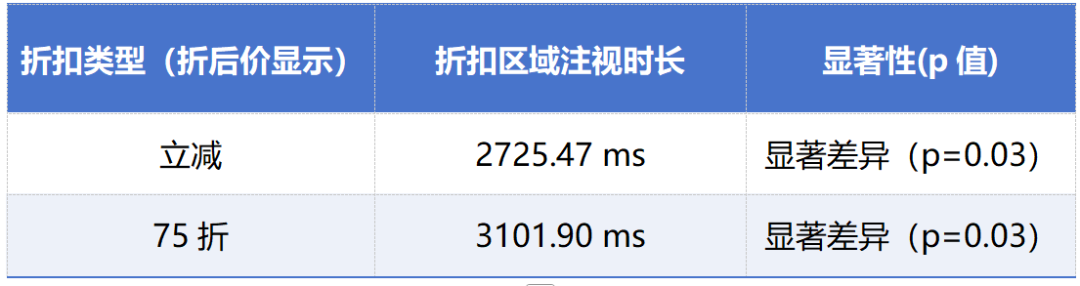
The effect of discount type on visual attention was further validated by analyzing data on eye-movement gaze duration:
75The visual processing of discount promotional messages is more complex, with a significant increase in consumer gaze time, indicating that discount messages are more difficult to process.
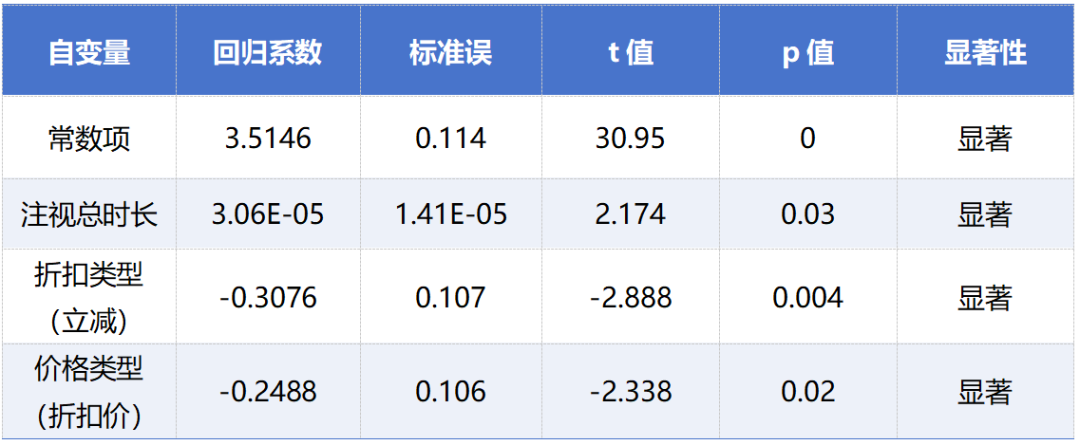
Regression analysis of attention duration and risk perception
Regression analysis was used to explore the predictive effect of gaze duration (an indicator of eye movement) on perceived risk:
Model significance: F=6.137, p=0.000405 (highly significant)
A positive regression coefficient for total gaze duration implies that the longer the gaze duration, the higher the perceived risk to the consumer.
Summary
Complex discounts (e.g., 75% off) trigger longer visual gaze when consumers are processing price information, which in turn enhances perceived risk.
Visual gaze behavior can reflect consumers' inherent decision-making difficulties and risk perception processes, and explicitly displaying the discounted price can effectively reduce these negative effects.


